Updated February 12th, 2019 by The Dividend Beginner
Monthly dividend stocks allow for dividend investors to compound their wealthy monthly as opposed to quarterly which is the most common dividend schedule in the world of investing. This frequent dividend payment allows for investors to reinvest their money more quickly if they are in the asset accumulation phase of their life, or to cover living expenses for retirees.
Below are three Canadian companies trading on the Toronto Stock Exchange which have dividend yields of 6 to 8 percent, and have paid dividends every single month for years. Two of the companies below have dividend growth histories spanning over a decade, for income investors which count on dividend growth to beat inflation year after year.
Canadian High-Yield Stock #1: Inter Pipeline Ltd. (IPL.TO)
Inter Pipeline is a major petroleum transportation, storage and natural gas liquids processing business based in Alberta, Canada. The company owns and operates four different business segments which operate in western Canada and Europe.
The four business segments of Inter Pipeline consist of: Oil sands transportation, NGL Processing, conventional oil pipelines and bulk liquid storage. The Oil sands transportation and NGL processing make up the majority of the company’s earnings clocking in at 80%, while the remaining 20% is left to the conventional oil pipelines and bulk liquid storage.
Source: Investor Presentation
The company’s long-term strategy is to acquire and develop high-quality assets that generate stable and predictable cash flow, while delivering strong returns to shareholders.
Inter Pipeline is currently developing Canada’s first integrated propane dehydrogenation (PDH) and polypropylene (PP) complex, which will launch them into their fifth business segment.
Propylene is a high-value and easy to transport plastic used in the manufacturing of a wide range of finished products, including consumer packaging and containers, textiles, automobile components and Canadian currency.
The Heartland Complex project is scheduled to begin producing polypropylene in late 2021; from there Inter Pipeline expects to earn approximately $450 to $500 million per year in long-term average annual EBITDA. $450 to $500 million would represent an approximately 40% increase over Inter Pipeline’s 2017 annual EBITDA; which is quite significant.
In Inter Pipeline’s most recent quarter (Q3 2018), funds from operations (FFO) totalled a quarterly record of $300 million, an 11 percent increase over third quarter 2017. FFO for the first nine months of 2018 were $815.4 million, vs. $722.8 million in 2017, a 12.81% increase.
Net income for the third quarter was a record $169 million, a 19 percent increase over third quarter 2017. Net income for the nine months ended Q3 2018 was $448.2 million, vs. $384.8 million in 2017, a 16.48 percent increase.
On a per share basis, funds from operations totalled $2.12 for the first nine months of 2018, vs. $1.94 in 2017, a 9.28% increase. Considering the FFO increase on a per-share basis is lower than the FFO increase as a whole company, we can automatically deduce that in 2018 there are more shares outstanding than in 2017.
Dividends per share for the first nine months of 2018 were $1.26 per share, representing a 59.6% payout ratio as a percentage of FFO. For the same period in 2017, the payout ratio was 62.6% while the dividend was even lower at $1.215 – displaying that Inter Pipeline is moving in the right direction as it lowers its payout ratio at the same time as increasing its dividend.
Source: Investor Presentation
While a safe and stable dividend is of utmost importance to dividend investors, it’s always a wonderful plus when the company is also committed to increasing the dividend every single year. Inter Pipeline is one of those such companies as it has consecutively increased its dividend every year without fail since 2009. The dividend has grown from $0.85 in 2000 to $1.71 for 2019 at its current monthly dividend, a 101% increase.
If you go back through the dividend history, you can see that IPL actually was increasing the dividend every year since 2002 but took a break in 2008 like many other companies did (including the Big Five Canadian banks).
It did not cut the dividend in 2008, and simply stalled for one year before continuing to increase the dividend every year. This means Inter Pipeline has a seventeen year history of being a dividend growth company.
Source: Investor Presentation
For the ten year period from 2009 to today, the compound annual growth rate of IPL’s dividend was 7.3%, but has more recently slowed to 5.3% over the last five years.
The company’s slowing dividend growth reflects prudent financial oversight as they invest further into diversifying and growing their business and other organic opportunities, which protects their dividend and continues to make these raises possible. In Inter Pipeline’s case, consistency and safety are more important than raising the dividend beyond it’s already large yield.
Since Inter Pipeline is the type of company where we use funds from operations to calculate dividend payout ratio, it’s also one where we can valuate it based on price-to-FFO. With trailing twelve months FFO of $2.83 per share, and Inter Pipeline’s current share price of $21.10, IPL’s P/FFO is 7.5.
At the same time, IPL’s trailing PE is 13.7, while it’s 5-year average trailing PE is 21.8, resulting in a 37% discount on a 5-year PE basis.
While it’s annual dividend is $1.71, and with a share price of $21.10, Inter Pipeline shares are yielding 8.1%; marking IPL as the highest yielding stock in this group of Canadian monthly dividend payers.
Inter Pipeline is a diversified business consisting of four segments, currently aiming for it’s fifth with the development of the Heartland Complex. The company has proven itself with net earnings growth as well as funds from operations growth. As a result of this growth, it has been able to increase its dividend consecutively since 2002, with a brief pause in 2008 like many other companies.
With its current share price, the company is yielding 8.1% and pays its dividend monthly. This is a good opportunity to diversify your income stream and compound it every month, however keep in mind that they do raise money by issuing shares every so often – which can potentially present a good entry point.
Canadian High-Yield Stock #2: Exchange Income Corporation (EIF.TO)
Exchange Income Corporation is a business which makes investments and acquires companies in the aerospace and aviation services and equipment sector, as well as the manufacturing sector.
The companies acquired are in defensible niche markets – medevac transportation, manufacturing of aerospace and defense components, manufacturing of an advanced unitized “window wall system” used primarily in high-rise multi residential developments; the list goes on to the tune of 13+ individual operating subsidiaries.
The acquisition candidates must have a track record of profits and strong, continued cash flow generation with their management intact and committed to continue building the business.
The strategy of the company is to grow their portfolio of diversified niche operations through acquisition and growth opportunities, and the result of this is to provide shareholders with a reliable and growing dividend.
Source: Investor Relations
The corporation has increased their dividend 13 times in the last 14 years (keeping it stable through year 2009), at a 5% compound annual growth rate of the dividend. While a 5% dividend growth rate is not in the double digit territory, 13 years of dividend growth means a lot more on the Toronto Stock Exchange than it does on the NYSE considering how much smaller Canada’s list of dividend growth companies, or “aristocrats”, are.
Source: Investor Relations
According to their latest quarterly release, Payout ratio when calculated as a percentage of Free Cash Flow less Maintenance Capital Expenditures improved to 62% from 73% for the trailing twelve months. Payout ratio when calculated as a percentage of Adjusted Net Earnings strengthened to 75% from 86% for the trailing twelve months. In addition, the annual dividend payment was 4% higher than last year.
From these results, it’s clear that Exchange Income Corp. is significantly reducing the payout ratio while increasing the monthly dividend payment to shareholders – the perfect recipe for a dedicated dividend growth investor. The Q3 2018 payout ratio as a result of adjusted net earnings was as low as 58%, so the trajectory is strong.
What’s most surprising is even with such a safe dividend, the yield is north of 7.5%. Divided monthly, that’s a guaranteed 0.625% return on investment per month before taking capital appreciation into consideration.
For the trailing twelve months as of Q3 2018, adjusted net earnings rose 18% from the year prior, and 16% per share. Since 2010, the corporation achieved compounded annual growth rates of 22% for revenue and 26% for EBITDA.
According to Thomson Reuters, EIF.TO is currently trading at a PE of 13.40, while the 5-year average PE ratio is 28. This represents a 54% discount to the 5-year average, and seems like a steal with the earnings, dividend growth, and payout ratio numbers they boast.
Exchange Income Corp. is compounding EBITDA at incredible rates of 26% per year in the last eight years, lowering the payout ratio as a percentage of Free Cash Flow less Maintenance Capital Expenditures into the low 60%, and continues to raise its dividend following it’s streak of thirteen dividend raises in the last fourteen years.
At it’s huge PE discount, and large yield, Exchange Income Corporation appears to be a great fit for income investors and value investors.
Canadian High-Yield Stock #3: Dream Global REIT (DRG.UN)
Dream Global REIT owns and operates office and industrial properties in strong European markets. These properties are operated by an in-house local team of over 100 real estates professionals.
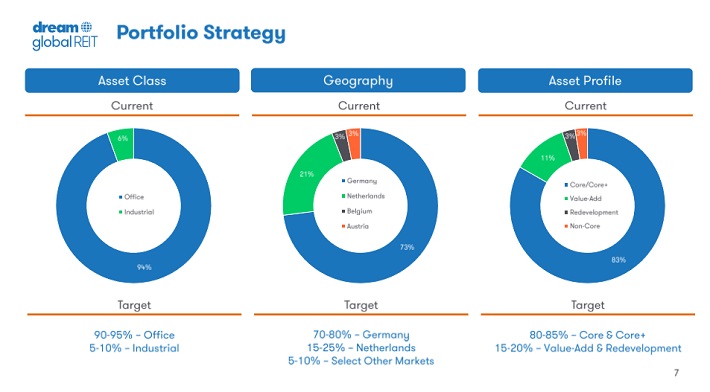
The majority of Dream Global’s $5.2B property portfolio is located in Germany with 73% of its total real estate. Beyond that, 21% of their real estate is located in the Netherlands with the remaining 6% made up of Belgium and Austria equally. The portfolio is made up of 236 properties, with $19.97 million leasable square feet.
Source: Investor Presentation
The property classes are split up with 90 – 95% being Office properties and the other 5 – 10% being Industrial properties. Essentially, Dream Global is heavily exposed to the German Office market, and in relation, German employment.
Source: Investor Presentation
German GDP growth somewhat slowed in 2018 at 1.5% vs. 2017 at 2.2%. The unemployment rate of Q3 2018 for Germany was actually very good at 3.7%, roughly the same as the U.S. unemployment for the same quarter. Currently the economy of Germany appears to be chugging along just fine, despite constant fears of a global economic slowdown.
Dream Global’s property portfolio is split up into four separate classifications: Core & Core+, Value-Add, Redevelopment and Non-Core.
Source: Investor Presentation
Dream Global focuses most of their business on Core & Core+ properties representing 83% of the real estate portfolio, and as they say, provides the foundation for their balance sheet. Value-Add properties appear to be their riskier bets with larger upside potential and makes up 11% of the portfolio.
The remaining 6% portion which classifies as redevelopment and non-core are projects where new buildings are to be developed or are small properties to sell for cash.
Adjusted funds from operations (AFFO) for the first nine months of 2018 was $132,692, while paying distributions of $110,226. On a per unit basis, Dream Global earned AFFO of $0.73, while the distribution was $0.60. This represents an 82% payout ratio and is really quite safe for an REIT.
For Q3 2018 in specific, the company had a payout ratio as low as 77% according to their Investor Presentation – however to note, it appears they calculated it using Funds from operations (FFO), which were $0.26 per share, rather than Adjusted funds from operations (AFFO) since it makes the payout ratio appear smaller.
Using AFFO, which was $0.24 per share, the payout ratio would be 83%. AFFO is a more accurate measure of the business since, unlike FFO, it deducts capital expenditures required to maintain the portfolio of properties, which are real expenses that should be accounted for.
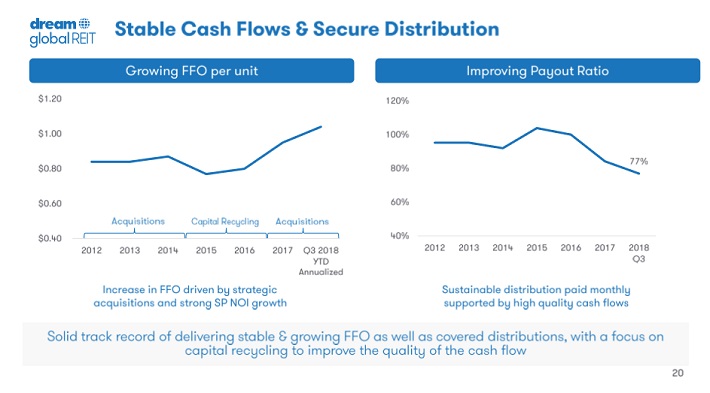
Source: Investor Presentation
With trailing twelve months AFFO of $0.97, and DRG.UN’s current price of $13.05, the P/AFFO is 13.45.
Since Dream Global REIT’s inception in 2011, the company has paid a dividend of $0.06667 per month. This comes out to an annual dividend of $0.80004, meaning at DRG.UN’s current price of $13.05, the yield is a whopping 6.1%. Even considering the huge dividend, Dream Global’s stock price has risen over 45% in the past 5 years for a powerful total return on investment.
Dream Global REIT is a unique REIT trading on the TSX, considering it owns and operates office and industrial properties across the ocean in its European markets – offering a high-yielding European diversification opportunity.
The large dividend is very safe, being backed by adjusted funds from operations; and has been consistent since the business’ inception in 2011.
There is room for dividend growth should management decide that is a route they would like to take, but for the time being its consistent monthly rent should suffice for dividend investors.