Updated on November 22nd, 2019 by Josh Arnold
Every year, we review each of the Dividend Aristocrats, a group of 57 companies in the S&P 500 Index with 25+ consecutive years of dividend increases.
In addition to the full downloadable spreadsheet, you can see a preview of the Dividend Aristocrats list in the table below:
In this installment, we’ll take a look at home improvement retailer Lowe’s Companies (LOW).
Lowe’s has a tremendous history of dividend growth. In addition to being a Dividend Aristocrat, Lowe’s is on the exclusive list of Dividend Kings, which have raised their dividends for an amazing 50+ years in a row. You can see the entire list of 27 Dividend Kings here.
Lowe’s dividend yield is average when compared with the S&P 500 Index. However, Lowe’s is a high-growth dividend stock. Indeed, Lowe’s 2018 dividend payout was more than double that of 2014. Lowe’s has a 1.9% dividend yield, and the potential for 10%+ annual dividend increases for a very long time to come. This article will discuss Lowe’s business model, growth potential, and valuation.
Business Overview
Lowe’s was founded in 1946. In the 73 years since, it has grown into the #2 home improvement retailer, behind only The Home Depot (HD). Lowe’s generates $72 billion in annual sales.
The company operates about 2,000 stores in the U.S., Canada, and Mexico. Lowe’s offers a wide range of products, for maintenance, repair, remodeling, and decorating the home. It has a wide selection of leading national brands, as well as a large number of private brands.
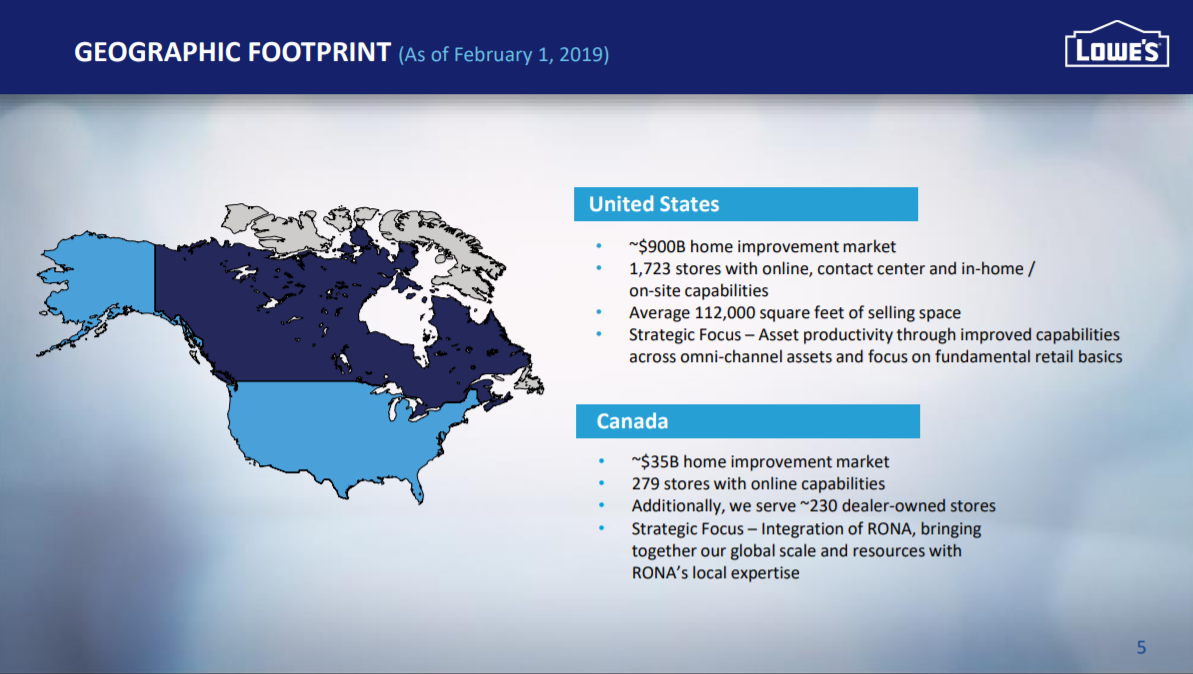
Source: Investor presentation, page 5
The company has a relatively small market share of the U.S. home improvement market, which Lowe’s estimates is about $900 billion annually. Its focus has been an omni-channel approach to serving DIY and Pro customers alike in order to capture as much market share as possible.
Source: Investor presentation, page 4
Lowe’s has made a concerted effort in recent years to improve its in-store experience for customers through merchandising and inventory practice optimization, as well as investing in the capabilities to fulfill orders outside of its stores. This includes special features for Pro customers that drive recurring revenue, as well as making it easier for DIY customers to order their products online, and pick them up or have them delivered. This is a strategic shift from the old model Lowe’s operated under, and it has worked well in recent years.
This is a difficult time for most retailers. The brick-and-mortar industry is under fierce pressure from e-commerce competition. Lowe’s, however, has shrugged off the poor performance of the broader retail industry. It continues to perform well, as consumers remain willing and able to spend on their homes.
And, while consumers desire the convenience of online shopping, many still value the in-store shopping experience for home improvement products. This is how Lowe’s has continued to grow over the past few years, even though many other retailers are struggling. As mentioned, Lowe’s has greatly improved its core in-store experience, and it has shown up in the company’s results.
Lowe’s comparable-store sales have increased for years since the Great Recession, and are expected to rise ~3% in fiscal 2019, according to its third quarter earnings.
Source: Earnings infographic
Total sales were essentially flat year-over-year in Q3 at $17.4 billion, but comparable sales rose 3% in the U.S. The difference is due to the company operating fewer stores today than it did a year ago. The gain in comparable sales was driven almost exclusively from higher average tickets, as transaction counts rose only fractionally. Further, gains in comparable sales were driven by large purchases of greater than $500. This is consistent with prior quarters for Lowe’s as it relies upon big ticket purchases for sales growth.
Gross margins were up to 32.4%, a gain of 156 basis points year-over-year. The company’s SG&A expense rate also improved by 126 bps, falling to 21.7% of revenue. These factors combined for much higher operating margins as Lowe’s gained 346 bps to 9% of revenue.
Guidance for this year includes a total sales gain of 2% on comparable sales rising 3%. Operating margins are expected to rise ~300 bps, but on an adjusted basis, they are expected to be up ~50 bps. Adjusted earnings-per-share should be in the range of $5.63 to $5.70. This represents a sizable gain against last year’s $5.10 in earnings-per-share.
Lowe’s continues to see operating leverage from rising revenue and prudent expense controls. This margin expansion is something we expect will continue for the foreseeable future, but only if comparable sales continue to rise.
Lowe’s has benefited from several fundamental tailwinds. The economy continues to grow, as does the housing market. Rising wages and home prices, as well as interest rates, are incentivizing more consumers to invest in their current homes rather than move. These tailwinds should continue to fuel growth for Lowe’s in the years ahead.
Growth Prospects
Lowe’s generally opens a small amount of new stores each year, so that is not a meaningful driver of growth. In contrast, the company is currently in the process of closing underperforming stores, particularly in Canada. However, it continues to find ways to capitalize on strong housing and construction spending, and we see these as growth drivers moving forward, whether or not the store count rises.
The U.S. economy continues to grow. Positive GDP growth is arguably the most important economic indicator for Lowe’s, as the company is highly reliant on consumer spending. Other important economic indicators for Lowe’s – which include the unemployment rate and housing prices – are trending in a positive direction as well.
In 2018, home prices neared or surpassed their pre-Great Recession peak of 2007 in many regions of the U.S. This is keeping homeowners in their houses longer, and thus, they are more willing to spend on improvements.
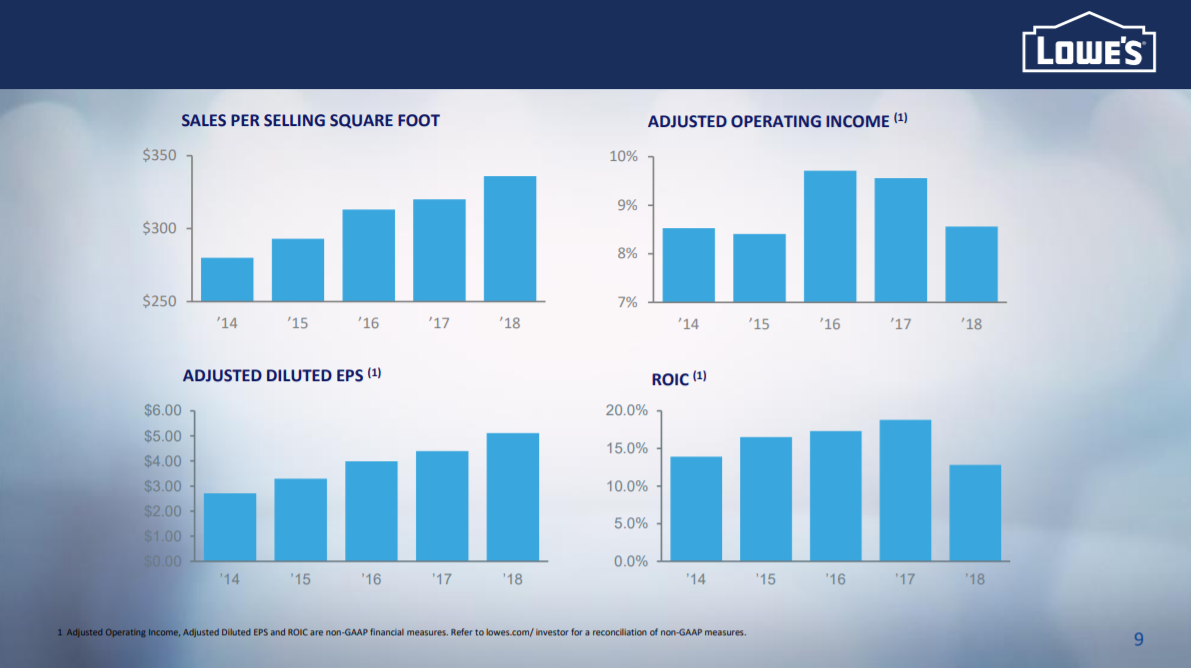
Source: Investor presentation, page 9
This has afforded Lowe’s the impressive growth above. Sales per selling square foot have trekked higher over time, gaining for many years. This has helped adjusted earnings-per-share continue to move higher over time, which we believe will continue for years to come.
Outside of the U.S., Lowe’s has targeted Canada as a key growth market. In 2016, Lowe’s acquired Canadian home improvement retailer Rona, for $2.3 billion. Adding Rona gave Lowe’s access to the attractive Canadian home improvement market, which grew at a 4% annual rate from 2014 to 2018. Rona’s footprint is concentrated in Quebec, which is home to 25% of the country’s home improvement market.
Lowe’s has enjoyed not only the sales growth that came with the Rona acquisition, but synergies as well, totaling hundreds of millions of dollars annually. The Canada business continues to perform well and Lowe’s is investing in that country to fuel future growth as the core U.S. business is maturing somewhat.
Lastly, Lowe’s is building its own digital platform, to keep up with e-commerce retailers. The company’s omni-channel strategy is working, as comparable sales increased 3% on lowes.com last quarter. This is a marked slowdown from prior years, but this is to be expected given that the web business is much larger than it used to be.
The combination of continued expansion in e-commerce, and growth in Canada should allow Lowe’s to reach its financial targets. We also see expansion of operating margins and share repurchases as fueling 8.2% annual earnings-per-share growth in the coming years.
Competitive Advantages & Recession Performance
The retail industry typically does not offer many competitive advantages. This is a highly challenging retail environment, as the rise of Amazon and other Internet retailers threatens to undercut brick-and-mortar stores. Consumers have shifted spending dollars toward e-commerce for the convenience and low prices. However, Lowe’s is a specialty retailer, which provides it with a competitive advantage.
Home improvement projects are often complex. Consumers are willing to travel to stores, to inspect products in person, and ask questions to staff members. This has helped protect home improvement retailers from Amazon (AMZN) thus far.
In addition, Lowe’s has the scale to compete on price, even with web retailers. Lowe’s operates in an industry that is essentially a duopoly; Lowe’s dominates home improvement retail along with competitor Home Depot.
Lowe’s has the scale to reap significant efficiencies in distribution, and with suppliers. It can leverage its size to keep costs low, which it can then pass on to customers in low prices. This helps drive operating leverage that boosts margins.
That said, Lowe’s is not immune from recessions. Consumer spending typically declines during economic downturns. Lowe’s depends on a financially-healthy consumer, with strong housing and construction markets. The Great Recession was a particularly steep downturn, which took a significant toll on Lowe’s bottom line.
Lowe’s earnings-per-share during the Great Recession are below:
2007 earnings-per-share of $1.86 2008 earnings-per-share of $1.49 (20% decline) 2009 earnings-per-share of $1.21 (19% decline) 2010 earnings-per-share of $1.44 (19% increase)Lowe’s earnings fell sharply during the recession, but the company still remained profitable. This helped it continue increasing its dividend each year. And, it bounced back just as quickly: by 2013, Lowe’s earnings-per-share had surpassed 2007 levels.
Valuation & Expected Returns
Lowe’s has a price-to-earnings ratio of 21.1 after a significant rally thus far in 2019. This is in excess of our fair value estimate of 18.2 times earnings, so we see the stock as somewhat overvalued after the strong move in the stock this year. We believe a lower price-to-earnings ratio is prudent given that comparable sales are slowing and that the risk of recession is rising as the economic recovery enters its 11th year.
Lowe’s stock currently trades above our fair value estimate. As a result, a declining price-to-earnings ratio could reduce future returns by approximately 2.9% per year. In addition to valuation changes, Lowe’s returns will consist of earnings growth and dividends.
We see longer-term earnings-per-share growth at 8.2% annually, plus the current 1.9% yield, and a slight headwind from a declining valuation. That would produce overall total annual returns in the 7.1% range, which is certainly respectable, but only good enough to warrant a hold recommendation at current prices.
The dividend remains near 40% of earnings, so there is certainly plenty of room for additional dividend growth in the coming years. We see Lowe’s as one of the better large-cap dividend growth stocks in the market today, but the stock appears overvalued at the present time.
Final Thoughts
Lowe’s has a relatively low dividend yield below 2%, but it makes up for this with high dividend growth rates. The company consistently provides double-digit dividend growth each year. The current environment is difficult for retail, but Lowe’s operates in a niche that should withstand e-commerce competitors.
Lowe’s is still growing sales and earnings, which should allow for continued dividend growth. And, it has a low dividend payout ratio, which also supports high dividend increases. The stock may not be enticing for investors interested in high yields, but Lowe’s should continue to increase its dividend each year. However, due to a high current valuation and a low expected rate of return, investors should wait for a better price before buying the stock.