Updated on November 26th, 2019 by Eli Inkrot
Only companies with at least 25 years of dividend growth can claim the title of being a Dividend Aristocrat. This club is so exclusive that there are only 57 such companies in the S&P 500 Index. The following downloadable spreadsheet shows all 57 Dividend Aristocrats today:
In addition to the full downloadable spreadsheet, you can see a preview of the Dividend Aristocrats list in the table below:
Chubb Ltd. (CB) is a recent addition to the list, having joined last year. It announced its 26th consecutive year of increasing its dividend in May 2019.
Chubb is a global provider of insurance and reinsurance services. The stock currently yields 2.0%; however, after accounting for dividend withholding taxes, Chubb has a more modest 1.3% dividend yield. Chubb is not a high-yield dividend stock, but it does provide consistent dividend increases each year.
Business Overview
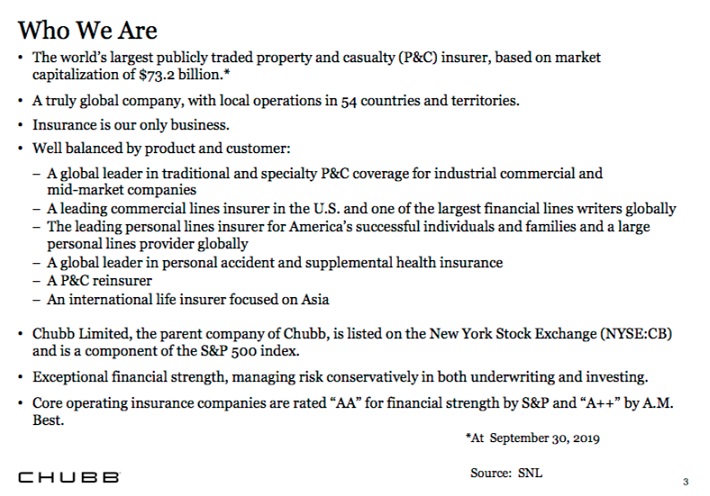
Chubb is based in Zurich, Switzerland and provides insurance services including property & casualty insurance, accident & health insurance, life insurance, and reinsurance. The company operates in 54 countries and territories. It is the world’s largest publicly traded P&C insurance company and the largest commercial insurer in the U.S.
Source: Chubb Corporate Presentation, Third Quarter 2019
The current version of Chubb was created in 2016, when Ace Limited acquired the ‘old’ Chubb and adopted its name. U.S. investors can initiate an ownership position in Chubb through shares listed on the New York Stock Exchange under the stock symbol CB.
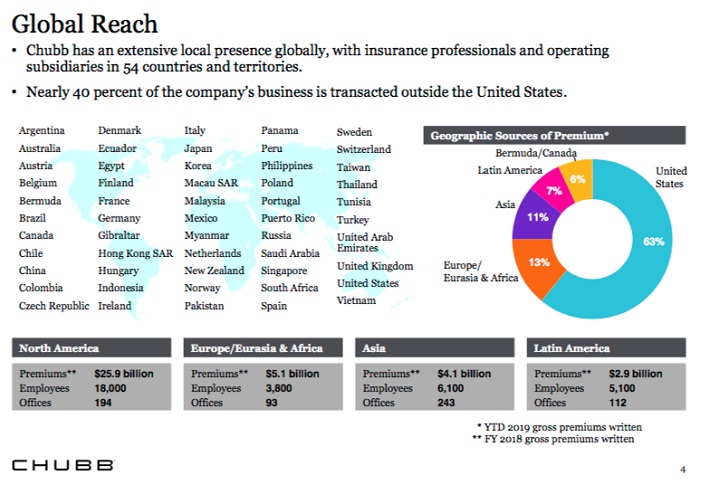
Source: Chubb Corporate Presentation, Third Quarter 2019
On October 29th, Chubb reported third quarter 2019 earnings results. Earned premiums totaled $8.3 billion during the quarter, up 5.2% from the previous year’s quarter. Net written premiums rose 6% year-over-year, and by 7% in constant currencies. Chubb generated net investment income of $870 million, up 6.1% from $820 million in Q3 2018.
Chubb generated earnings-per-share of $2.70 during the third quarter, which was slightly more than what the analyst community had forecasted. Chubb grew its earnings-per-share by 12% versus the previous year’s quarter. Net profits benefited from higher earned premiums and higher investment income.
Chubb also benefited from a slightly lower combined ratio, which dropped to 90.2%. Chubb continued the trend of growing its book value, which grew to $120.33 at the end of the third quarter, while tangible book value stood at $76.21, up 10% and 16%, respectively, from the end of fiscal 2018.
Note: The combined ratio is calculated as the sum of incurred losses and expenses divided by earned premiums. A combined ratio under 100% shows the insurance company is operating profitably before investment income. A combined ratio in excess of 100% shows unprofitable underwriting.
Growth Prospects
Chubb has not grown significantly in the last decade. As an illustration, despite earnings-per-share jumping 17.8% from 2017 to 2018, Chubb has only been able to grow its earnings-per-share by an average compound rate of 1.4% per year dating back to 2007.
That said, Chubb has created significant value for shareholders in terms of book value per share, an important metric for insurance companies. Since 2007 the company’s book value has grown at a compound average growth rate of 8.7% per year.
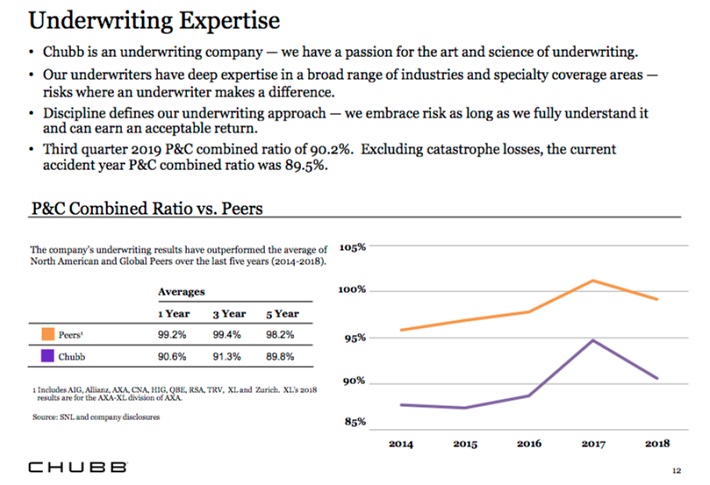
Chubb compares favorably in terms of profitability versus many of its peers. Its combined ratio for the first three quarters of 2019 was 90%. Chubb has outperformed its peers on this metric over the past 3, 5, and 10 years. The company has beaten its peers by ~9% for each period of time.
Source: Chubb Corporate Presentation, Third Quarter 2019
As an insurance company, Chubb has a large pool of accumulated premium income that has not been paid out in claims to customers. This is known as float. Insurers invest premiums as soon as they are collected, to earn interest or other income.
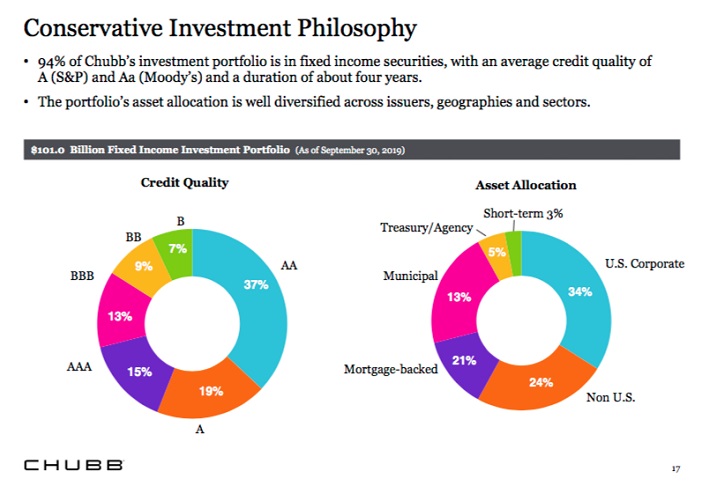
Chubb had an investment portfolio of $107 billion at the end of the most recent quarter, invested primarily in investment-grade fixed income securities.
Source: Chubb Corporate Presentation, Third Quarter 2019
Over the long-term higher interest rates can be a positive for Chubb’s investment income, but lower rates have been a headwind as of late. Chubb can also grow earnings-per-share through share repurchases.
In November 2019, Chubb authorized a new $1.5 billion share repurchase program that will be effective through December 31st, 2020. Overall, we estimate Chubb could grow book value by 6% annually over the next five years.
Competitive Advantages & Recession Performance
Chubb’s competitive advantages are its leading industry position, as well as its financial strength. First, Chubb is the world’s largest publicly traded property and casualty insurance company, and the largest commercial insurer in the United States. It has a dominant position across its product categories, which helps it to retain customers.
It is also in strong financial position. Chubb is rated AA from Standard & Poor’s, AA from Fitch, and Aa3 from Moody’s, the three major U.S. credit ratings agencies. Its healthy balance sheet and high credit rating provide the company with financial strength that helps retain clients and invest for growth.
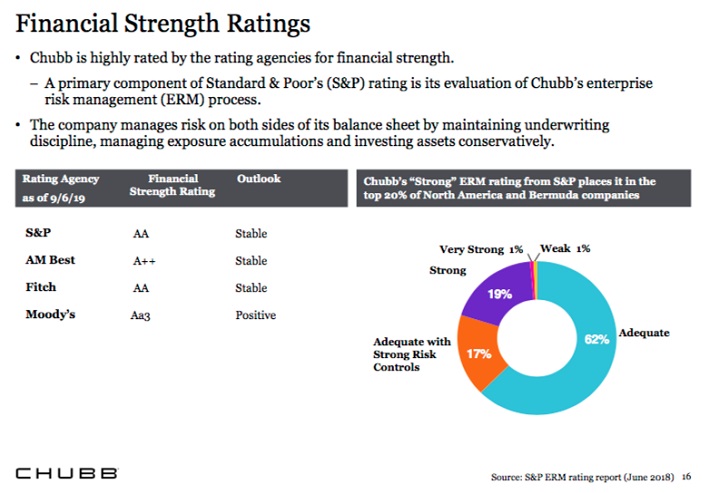
Source: Chubb Corporate Presentation, Third Quarter 2019
Chubb is also a fairly diversified company, with roughly 40% of the company’s business transacted outside of the U.S. This provides Chubb with growth potential in the international markets.
The insurance industry can be incredibly cyclical. As the economy strengths, people tend to have more discretionary capital that can be used to add to their insurance policies. If the economy weakens, customers may pull back on their spending. This occurred during the last recession for Chubb.
2007 earnings-per-share of $8.07 2008 earnings-per-share of $7.72 (-4.3% decrease) 2009 earnings-per-share of $8.17 (5.8% increase) 2010 earnings-per-share of $7.79 (-4.7% decrease) 2011 earnings-per-share of $6.96 (-10.7% decrease)Although Chubb didn’t see quite as severe profit declines as many other financial firms, earnings-per-share did experience some variability. However, Chubb remained highly profitable during the Great Recession, which allowed it to continue raising its dividend even through the steep economic downturn.
While earnings-per-share haven’t grown much in the last decade, the company’s book value has increased nearly each and every year, with the only exception being 2015. We expect that book value will continue to grow in the coming years, but at a slightly slower pace than its 8.7% annual average rate.
Valuation & Expected Returns
Using Chubb’s most recent share price of ~$151, along with expected earnings-per-share of $10.89 and $123 per share in book value for 2019, the security is currently trading at a price-to-earnings ratio of 13.9 and a price-to-book ratio of 1.23.
We believe that valuing Chubb solely through the lens of earnings-per-share does not paint the full picture of the company’s worth. In addition to earnings-per-share, investors should also consider book value per share when thinking about the valuation of insurance companies.
The stock has an average price-to-book ratio of 1.06 over the last decade. If shares were to revert to this average value by 2024, investors would see total returns reduced by nearly -3% per year.
Taking the company’s expected growth rate (6%), dividend yield (2%) and potential book value multiple reversion (-3%) collectively leads to a mid-single-digit total return expectation of 5% on an annualized basis.
Final Thoughts
While Chubb is a well-managed and diversified insurance company with a long history of growing book value, we find the total projected return to be average. This is due to the high P/B valuation of the stock when compared to its 10-year average. The stability in a cyclical industry is noteworthy, as is the exceptional dividend growth record, but the current valuation makes the stock a hold, and not a buy right now.