Updated on November 22nd, 2019 by Josh Arnold
Nucor (NUE) is the largest steel producer in North America. Despite operating in the notoriously volatile raw materials sector, Nucor is also a remarkably consistent performer. The company has increased its annual dividend for 46 consecutive years, which qualifies it to be a member of the Dividend Aristocrats.
In addition to the full downloadable spreadsheet, you can see a preview of the Dividend Aristocrats list in the table below:
We expect Nucor to raise its payout once again before the year is out, increasing its streak to the elite level of 47 consecutive years.
Nucor’s dividend consistency allows it to stand out in its sector and among the Dividend Aristocrats. There are currently just six Dividend Aristocrats from the materials sector. This article will analyze Nucor’s business model, growth prospects, and its valuation to determine whether the stock is a buy right now.
Business Overview
Nucor is the largest steel producer in North America after decades of growth. The company is headquartered in Charlotte, North Carolina and has a market capitalization of $17 billion.
Nucor was not always a leader in the steel manufacturing industry. The company has a long and convoluted corporate history that can be traced back to the company’s founder, Ransom E. Olds (the creator of the Oldsmobile automobile). Olds left his own automotive company over a disagreement with shareholders to form the REO Motor Company, which eventually transformed into the Nuclear Corporation of America – Nucor’s first predecessor.
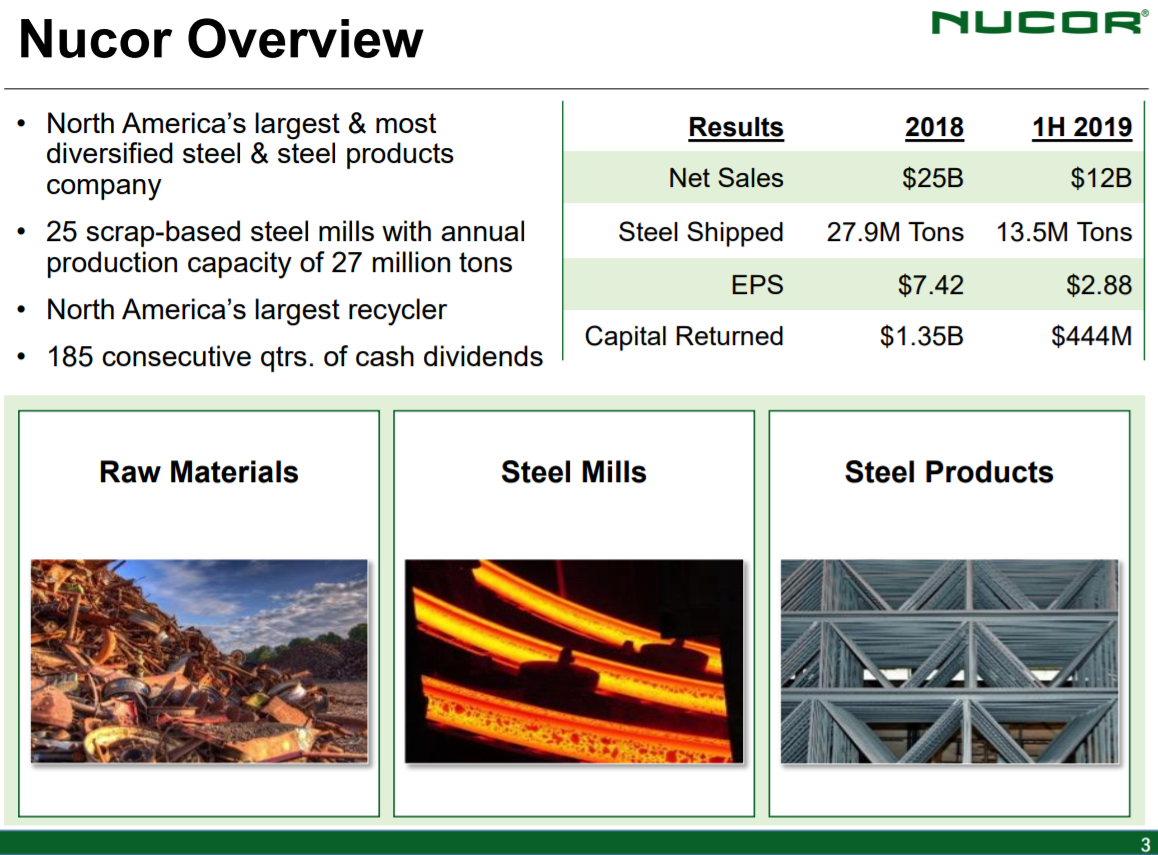
The company currently operates in three segments: Steel Mills (the largest segment by revenue), Steel Products, and Raw Materials.
Source: Investor presentation, page 3
Nucor manufactures a wide variety of material types, including sheet steel, steel bars, structural formations, steel plates, downstream products, and raw materials. The majority of the company’s production comes from a combination of sheet and bar steel, as has been the case for many years.
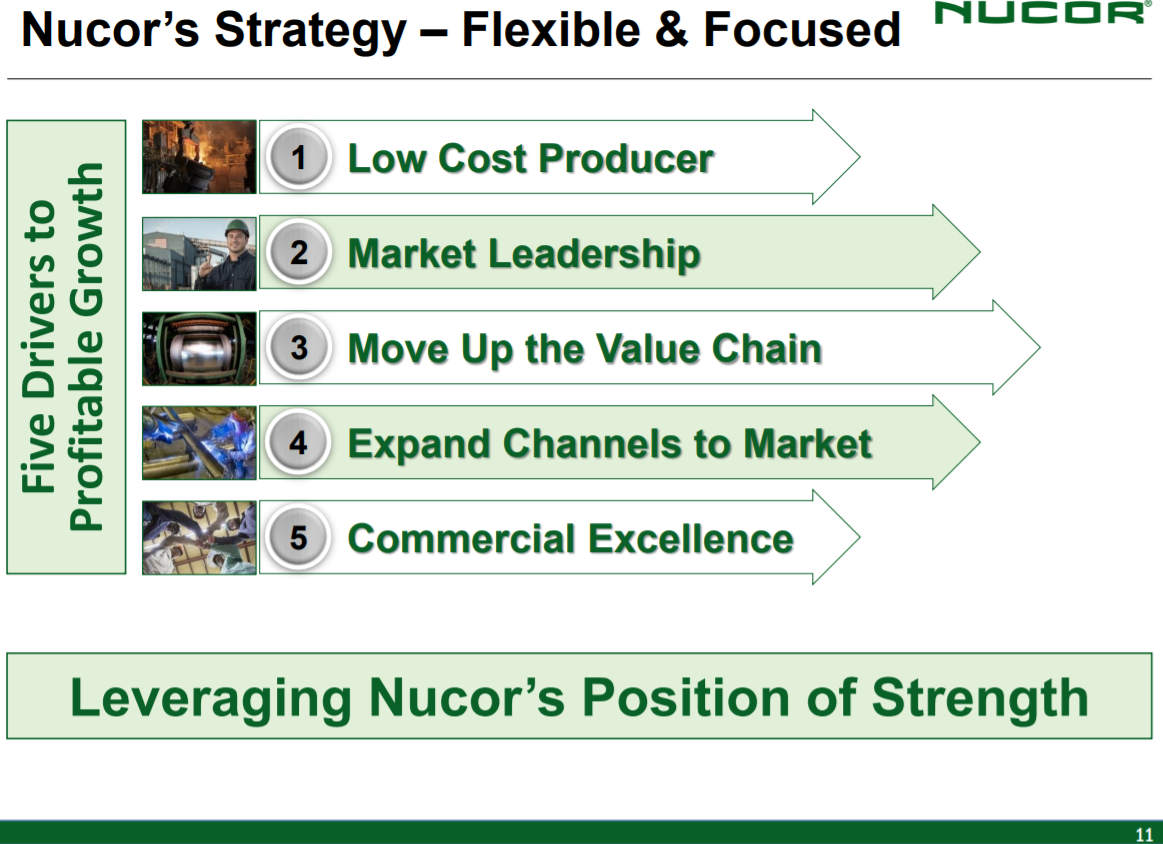
Source: Investor presentation, page 11
Nucor has been successful over the long-term because of the above principles. The company continues to focus on being a low cost producer, first and foremost. This allows it maintain profitability during downturns, as well as produce significant operating leverage during better times. In addition, it has worked to expand its product offerings to new markets, and maintain and grow its market leadership in existing channels. Over time, these principles have served Nucor very well, which is why it is the largest North American producer today.
The past several years have been tough on Nucor thanks to a significant global supply glut in the steel market. In addition, state-subsidized steel production in China continues to support high levels of supply and low pricing. However, there are several factors that suggest the company’s performance should improve over the next several years. These factors are discussed further in the following section.
Growth Prospects
The past several years have been volatile for Nucor and its competitors around the globe. Steels prices have been highly volatile, driven primarily by a supply glut coming out of international markets, specifically China. The Chinese government, in order to protect Chinese producers of steel, has flooded global markets with certain types of steel products to make it more difficult for non-Chinese producers to compete.
This has resulted in decreased production due to over-supply, harming Nucor’s profitability. However, 2017 was certainly a strong rebound from the bottom, and 2018 was another strong year. We see these issues as producing much lower earnings-per-share for 2019, however, as has been evidenced by results from the first three quarters of the year.
Nucor’s first nine months results showed a revenue decline of 7% to $17.5 billion as total tons shipped to customers declined 5% to 20 million. In addition, average sales price per ton fell 2%, exacerbating the volume decline. The average scrap cost per ton used over the same period was $328, a decline of 9% year-over-year, helping to mitigate some of the damage via lower expenses. Overall operating rates in the first three quarters of the year declined from 93% in 2018 to 85% this year, illustrating the oversupply situation as Nucor cannot run its factories at full capacity.
Nucor is also likely to drive growth through acquisitions moving forward. The company has historically executed strategic bolt-on acquisitions when appropriate and has stated its goal is to continue to do so, adding mills and capacity in the process.
Nucor’s unique ability to grow dividends for 46 years, even as a commodity producer, is due largely to its status as a low-cost producer.
Source: Investor presentation, page 6
This has helped Nucor remain profitable and grow dividends through all economic cycles, while so many higher-cost commodity producers cannot stand the test of time.
Investors can get a sense of how quickly Nucor is likely to grow moving forward by looking at the company’s historical growth rates. Between 2001 and 2016, Nucor compounded its adjusted earnings-per-share at a rate of ~13% even though 2016 was still a year of depressed earnings for this steelmaker.
We believe that Nucor is likely to deliver just 3% adjusted earnings-per-share growth from this point forward, although bottom line growth will be lumpy thanks to Nucor’s presence in the cyclical materials sector. The enormous rebound in earnings seen in 2017 and 2018 has created what we believe may be close to a top in near-term earnings potential for Nucor. Indeed, 2019 earnings should be around $5.30 per share, down from $7.42 last year.
However, for the long-term, Nucor’s markets have largely favorable outlooks.
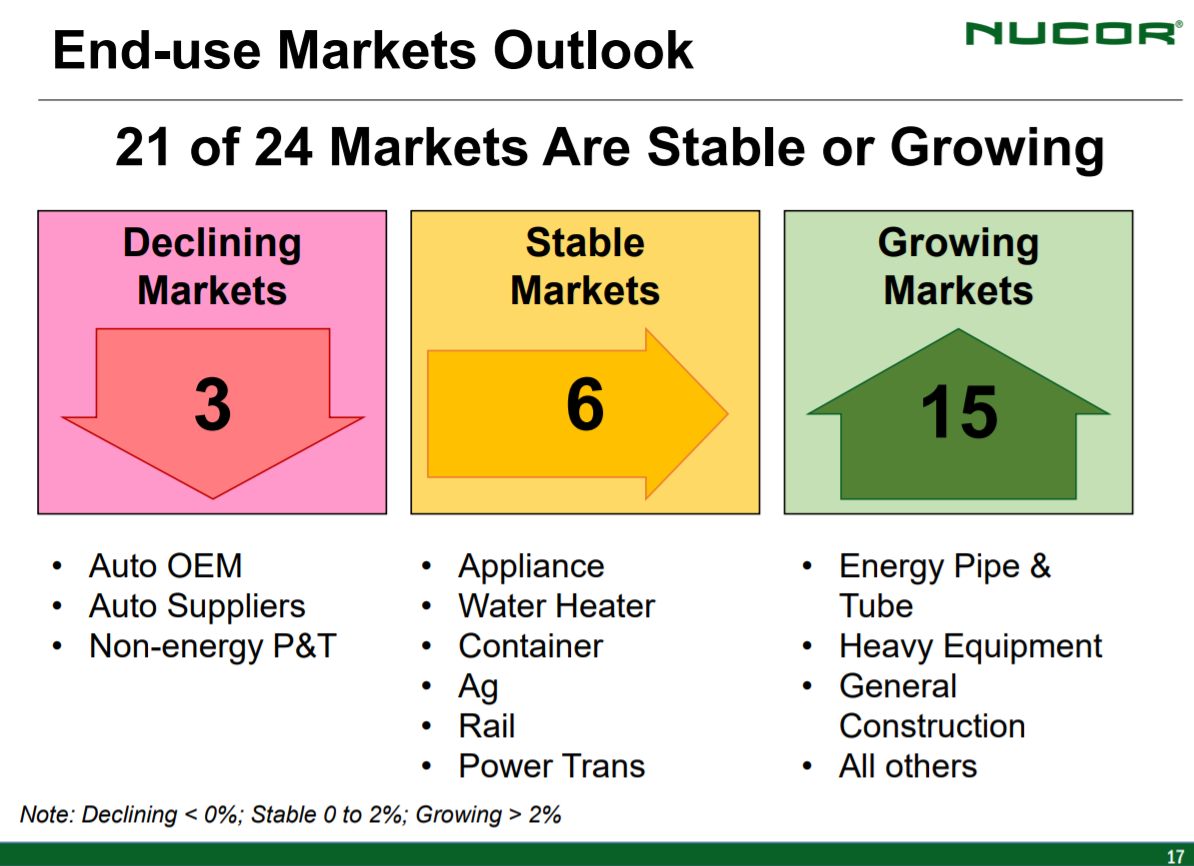
Source: Investor presentation, page 17
The vast majority of its markets are stable or growing, with 15 of 24 characterized as growing. Nucor’s diversification in terms of end markets is a key driver for not only growth, but also offer some relative safety when downturns strike. This helps the company perform well compared to other steel makers during recessions.
Competitive Advantages & Recession Performance
Nucor is a manufacturer and distributor of a raw material, steel. Accordingly, the company is a ‘commodity business’ – one in which the single largest differentiator between competitors is price.
Warren Buffett has the following to say about commodity businesses:
“Stocks of companies selling commodity-like products should come with a warning label: ‘Competition may prove hazardous to human wealth.’” – Warren Buffett
Certainly, commodity businesses are not the most defensive businesses thanks to their cyclicality. This can be seen by looking at Nucor’s performance during the 2007-2009 financial crisis:
2007 adjusted earnings-per-share: $4.98 2008 adjusted earnings-per-share: $6.01 2009 adjusted earnings-per-share: net loss of ($0.94) 2010 adjusted earnings-per-share: $0.42 2011 adjusted earnings-per-share: $2.45Nucor’s earnings-per-share were decimated by the financial crisis. The company is one of few Dividend Aristocrats whose earnings actually turned negative during this tumultuous time period. Earnings have only recently caught up to their pre-recession levels, although Nucor has continued to steadily increase its dividend payments.
With all this in mind, Nucor should not be viewed as a defensive investment. Investors should expect the company to suffer during economic downturns. In addition, with steel being used as a political bargaining chip internationally, investors should be aware that the company’s fortunes aren’t tied only to its own actions, but potentially also to those of external forces.
Valuation & Expected Returns
Nucor is expected to report adjusted earnings-per-share of about $5.31 in fiscal 2019. This would represent a sizable decline from fiscal 2018 earnings of $7.42. That puts the company’s price-to-earnings ratio at 10.2, which is low relative to many sectors in the stock market, but for steel producers we are more cautious.
We see fair value at 6.5 times earnings, meaning Nucor is substantially overvalued today. Part of this is certainly because earnings have declined materially this year while the share price has held up relatively well. However, the stock is still quite expensive in our view, trading for over 150% of fair value.
The cyclicality of Nucor’s business model means that changing which year’s earnings that you use has a significant impact on the company’s valuation. Indeed, 2018’s earnings-per-share represented the top of this cycle and thus, the stock appeared cheap at that point.
Given this, using dividend yield as a valuation metric can help to inform investors’ understanding of the valuation. The current yield is 2.9%, which is roughly in-line with its historical dividend yields, although as expected, that metric is quite volatile as well.
We see total annual returns of -2.1% in the coming years as earnings and the dividend are more than offset by valuation movements. Thus, the yield of 2.9% is probably the most appealing aspect of Nucor stock for investors. Nucor would be vulnerable to an economic downturn, meaning investors should consider the impact of a recession before buying shares. In addition, given the high valuation, we think investors should wait for a better price.
Final Thoughts
Nucor’s status as a Dividend Aristocrat helps it to stand out among the highly volatile materials sector. There are very few raw materials businesses that have multi-decade track records of compounding their adjusted earnings-per-share.
Nucor has a higher dividend yield than the S&P 500 Index, and the company has a long history of annual dividend increases. Nucor also has a strong industry position and a healthy balance sheet.
However, the current stock valuation does not merit a buy recommendation. And, the company would be significantly affected by a recession. For investors that are looking for raw materials exposure, we recommend waiting for a better opportunity to acquire shares of Nucor.