Spreadsheet data updated daily
In the accumulation stage, investors do not need to generate meaningful income from their investment portfolios. They are instead focused on generating the maximum return possible for a given level of risk.
Retired investors face entirely different challenges. They need to generate consistent dividend income that varies little on a month-to-month basis. This means retirees are required to dilligently structure their portfolio so that they receive the same amount of dividends each month.
With this in mind, we have constructed a list of stocks that pay dividends in March, which you can download below:
The list of stocks that pay dividends in March available for download at the link above contains the following metrics for each stock in the database:
Name
Ticker
Stock price
Dividend yield
Market capitalization
P/E Ratio
Payout Ratio
Beta
Additionally, you can find and sort March paying dividend stocks using the table below.
Ticker Name Price Dividend Yield Market Cap ($M) P/E Ratio Payout Ratio
AAT
American Assets Trust, Inc.
47.02
2.4
2,808.1
60.5
144.1
ABC
AmerisourceBergen Corp.
87.39
1.8
18,205.6
19.4
35.5
ABEV
Ambev SA
4.37
1.9
68,754.5
23.3
43.5
ABR
Arbor Realty Trust, Inc.
13.54
9.3
1,277.4
9.4
87.9
ABX
Barrick Gold Corporation
0.00
0.0
0.0
ACET
0.00
0.0
0.0
ACNB
ACNB Corp.
34.65
3.5
245.1
10.3
36.0
ADI
Analog Devices, Inc.
108.83
1.9
40,202.5
26.6
51.3
ADM
Archer-Daniels-Midland Co.
41.30
3.4
23,003.0
17.6
59.2
ADS
Alliance Data Systems Corp.
106.79
2.9
5,456.8
12.4
36.0
AE
Adams Resources & Energy, Inc.
30.79
3.0
130.4
41.9
125.2
AEE
Ameren Corp.
75.84
3.2
18,641.7
23.4
73.8
AEM
Agnico Eagle Mines Ltd.
58.44
3.1
13,986.4
-53.9
-169.3
AEP
American Electric Power Co., Inc.
93.37
3.6
46,120.3
21.6
78.3
AFL
Aflac, Inc.
53.51
2.5
39,336.8
13.1
32.9
AGCO
AGCO Corp.
77.00
1.0
5,870.5
15.8
16.0
AGM
Federal Agricultural Mortgage Corp.
85.33
3.1
913.1
9.5
29.7
AGN
Allergan Plc
174.22
2.1
57,161.1
-6.8
-14.4
AGNC
AGNC Investment Corp.
16.65
13.3
9,121.2
-10.8
-144.2
AGO
Assured Guaranty Ltd.
46.72
1.5
4,611.7
11.0
16.5
AHC
A.H. Belo Corp.
3.70
10.8
79.5
6.2
66.6
AHL
Aspen Insurance Holdings Limited
0.00
0.0
0.0
AIG
American International Group, Inc.
52.55
2.4
45,713.7
-525.5
-1,280.0
AIZ
Assurant, Inc.
125.31
1.9
7,660.3
21.3
40.7
AJG
Arthur J. Gallagher & Co.
89.70
2.4
16,690.5
24.1
57.3
AJX
Great Ajax Corp.
15.56
8.5
305.8
8.9
75.9
ALE
ALLETE, Inc.
85.43
3.4
4,413.0
22.4
76.3
ALGT
Allegiant Travel Co.
171.38
2.0
2,784.2
13.1
26.8
ALK
Alaska Air Group, Inc.
70.08
2.0
8,639.3
14.1
27.7
ALLE
Allegion Plc
115.32
0.9
10,715.2
23.9
21.1
ALOT
AstroNova, Inc.
15.86
1.8
111.8
17.3
30.6
ALV
Autoliv, Inc.
79.68
3.8
7,107.8
32.3
123.0
AMAT
Applied Materials, Inc.
56.95
1.8
52,607.8
18.8
33.9
AMC
AMC Entertainment Holdings, Inc.
9.91
10.1
1,029.2
181.8
1,834.9
AME
AMETEK, Inc.
90.40
0.6
20,642.5
25.1
15.6
AMGN
Amgen, Inc.
205.01
3.5
122,944.7
16.1
56.0
AMNB
American National Bankshares, Inc. (Virginia)
36.48
2.8
405.5
18.9
52.8
AMSF
AMERISAFE, Inc.
62.91
7.1
1,214.1
15.9
113.3
ANAT
American National Insurance Co.
119.60
2.7
3,215.7
7.8
21.3
ANF
Abercrombie & Fitch Co.
17.34
4.6
1,090.0
16.4
75.5
ANTM
Anthem, Inc.
267.67
1.5
67,871.5
16.0
23.6
APC
Anadarko Petroleum Corp.
72.77
1.2
36,563.5
-60.9
-75.3
APLE
Apple Hospitality REIT, Inc.
16.38
7.9
3,667.0
18.9
149.9
ARCC
Ares Capital Corp.
18.47
9.0
7,881.5
10.1
91.7
ARII
American Railcar Industries, Inc.
0.00
0.0
0.0
ARMK
Aramark
44.26
1.0
10,928.2
20.3
20.2
AROW
Arrow Financial Corp.
34.78
3.0
520.6
14.2
42.5
ARR
ARMOUR Residential REIT, Inc.
16.62
14.3
978.8
-1.4
-20.6
ASB
Associated Banc-Corp
20.47
3.3
3,260.7
10.2
33.8
ASH
Ashland Global Holdings, Inc.
77.44
1.4
4,700.8
46.3
62.6
ASTE
Astec Industries, Inc.
31.77
2.7
747.7
-303.1
-804.0
ATO
Atmos Energy Corp.
110.94
1.9
13,113.2
26.2
49.6
ATRI
Atrion Corp.
830.70
0.7
1,540.9
42.7
28.8
AVA
Avista Corp.
47.65
3.2
3,150.2
15.9
51.2
AVAL
Grupo Aval Acciones y Valores SA
7.99
6.1
2,842.9
8.7
52.7
AVGO
Broadcom, Inc.
291.55
3.6
115,649.4
-72.7
-264.3
AVT
Avnet, Inc.
39.86
2.0
4,024.3
31.9
64.9
AVX
AVX Corp.
15.64
5.9
2,644.6
11.4
67.0
AVY
Avery Dennison Corp.
127.49
2.2
10,733.8
AWK
American Water Works Co., Inc.
119.56
1.6
21,598.9
37.2
59.4
AWR
American States Water Co.
93.10
1.2
3,429.1
45.0
54.7
AYR
Aircastle Ltd.
26.71
4.5
2,001.9
9.9
44.3
AZN
AstraZeneca Plc
47.28
2.9
125,285.5
54.9
161.0
B
Barnes Group, Inc.
56.35
1.4
2,884.3
18.5
26.0
BA
The Boeing Co.
340.88
2.9
191,844.2
51.3
149.4
BAC
Bank of America Corp.
31.84
2.5
289,083.6
11.6
29.6
BAM
Brookfield Asset Management, Inc.
54.74
2.7
55,271.8
18.0
48.3
BANX
StoneCastle Financial Corp.
22.05
6.7
148.1
15.2
102.3
BBD
Banco Bradesco SA
9.15
6.1
36,784.4
13.5
82.2
BBDO
Banco Bradesco SA
8.44
14.1
34,284.0
12.5
176.4
BBL
BHP Group Plc
43.28
10.9
45,704.3
12.7
137.9
BBSI
Barrett Business Services, Inc.
87.96
1.2
657.1
13.7
16.3
BBT
BB&T Corp.
54.00
3.9
41,380.4
13.4
52.6
BC
Brunswick Corp.
60.07
1.8
5,149.5
-44.6
-80.1
BCO
The Brink's Co.
88.86
0.8
4,445.2
66.7
56.3
BDL
Flanigan's Enterprises, Inc.
22.87
1.2
42.5
12.7
15.5
BDX
Becton, Dickinson & Co.
246.08
1.3
66,430.3
84.6
105.8
BG
Bunge Ltd.
55.53
4.5
7,860.7
14.7
66.2
BGCP
BGC Partners, Inc.
5.36
13.8
1,866.3
33.1
456.8
BGFV
Big 5 Sporting Goods Corp.
2.60
7.7
56.4
-191.2
-1,470.6
BHB
Bar Harbor Bankshares
25.13
4.2
390.7
15.0
63.2
BHBK
0.00
0.0
0.0
BHLB
Berkshire Hills Bancorp, Inc.
30.83
3.0
1,569.4
17.5
51.6
BHP
BHP Group Ltd.
49.89
9.4
73,455.6
14.6
137.9
BKH
Black Hills Corp.
77.31
2.6
4,720.8
20.4
53.2
BLK
BlackRock, Inc.
466.56
2.8
72,397.5
17.8
49.8
BLKB
Blackbaud, Inc.
86.38
0.6
4,247.6
206.2
114.6
BLL
Ball Corp.
71.34
0.9
23,685.1
45.7
41.7
BLMN
Bloomin' Brands, Inc.
19.75
2.0
1,703.6
16.6
33.0
BMI
Badger Meter, Inc.
57.69
1.1
1,679.6
36.3
39.0
BMS
Bemis Co., Inc.
57.25
1.7
5,221.2
22.8
37.9
BMTC
Bryn Mawr Bank Corp.
37.76
3.4
759.9
12.7
42.7
BOH
Bank of Hawaii Corp.
86.33
6.0
3,507.2
15.9
96.0
BOTJ
Bank of the James Financial Group, Inc.
14.57
2.0
64.6
11.5
23.3
BP
BP Plc
39.24
6.3
132,021.5
14.8
92.8
BRKL
Brookline Bancorp, Inc.
15.74
3.4
1,260.4
14.5
50.0
BRKR
Bruker Corp.
43.86
0.4
6,850.2
36.4
13.1
BRKS
Brooks Automation, Inc.
44.00
0.9
3,177.9
88.7
80.6
BRSS
Global Brass & Copper Holdings, Inc.
43.99
0.6
965.7
16.0
9.8
BSBR
Banco Santander (Brasil) SA
12.28
4.3
46,115.4
25.4
110.0
BTU
Peabody Energy Corp.
14.93
18.5
1,661.7
3.5
64.3
BWA
BorgWarner, Inc.
40.41
1.7
8,345.3
10.9
18.4
BWFG
Bankwell Financial Group, Inc.
27.93
1.8
219.0
11.7
21.3
BWXT
BWX Technologies, Inc.
57.54
1.2
5,490.4
26.9
31.2
CA
CA, Inc.
0.00
0.0
0.0
CABO
Cable One, Inc.
1,313.75
0.6
7,496.3
48.0
30.1
CAE
CAE, Inc.
25.39
1.6
6,767.3
27.8
44.8
CAG
Conagra Brands, Inc.
27.30
3.1
13,285.7
19.1
59.5
CAKE
Cheesecake Factory, Inc.
42.87
3.2
1,876.3
17.8
57.3
CASS
Cass Information Systems, Inc.
54.07
2.4
783.4
25.1
60.9
CATO
The Cato Corp.
17.33
7.6
429.2
12.6
96.1
CATY
Cathay General Bancorp
36.31
3.4
2,894.2
10.5
36.0
CBFV
CB Financial Services, Inc.
26.49
3.6
143.9
13.5
48.5
CBOE
Cboe Global Markets, Inc.
113.22
1.1
12,644.6
31.2
35.5
CBSH
Commerce Bancshares, Inc. (Missouri)
64.58
1.6
6,933.6
17.2
27.1
CBT
Cabot Corp.
45.60
3.0
2,638.9
12.6
37.4
CC
The Chemours Co.
16.99
5.9
2,777.6
4.8
28.3
CCBG
Capital City Bank Group, Inc.
26.34
1.5
478.4
15.8
24.3
CCE
Coca-Cola European Partners plc
0.00
0.0
0.0
CCI
Crown Castle International Corp.
139.40
4.1
57,990.4
69.9
285.7
CCL
Carnival Corp.
44.18
5.7
23,276.3
10.0
56.4
CCNE
CNB Financial Corp. (Pennsylvania)
31.86
2.1
484.2
CCOI
Cogent Communications Holdings, Inc.
58.31
4.0
2,729.8
83.3
337.0
CDK
CDK Global, Inc.
50.18
1.2
6,092.2
54.0
64.6
CDW
CDW Corp.
125.14
0.9
18,232.6
26.8
25.1
CE
Celanese Corp.
121.56
2.0
14,693.4
16.9
33.3
CFR
Cullen/Frost Bankers, Inc.
93.74
2.9
5,873.4
13.1
38.5
CGNX
Cognex Corp.
50.81
0.4
9,212.3
51.5
19.1
CHCT
Community Healthcare Trust, Inc.
46.69
3.5
906.1
354.8
1,242.4
CHD
Church & Dwight Co., Inc.
74.60
1.2
18,433.4
30.4
36.7
CHE
Chemed Corp.
408.75
0.3
6,508.1
32.5
9.7
CHFC
Chemical Financial Corp.
42.04
3.2
3,008.3
10.9
35.2
CHKR
Chesapeake Granite Wash Trust
0.51
35.4
23.7
2.4
85.5
CHRW
C.H. Robinson Worldwide, Inc.
90.33
2.2
12,228.7
18.0
39.7
CIX
CompX International, Inc.
14.67
1.8
182.5
11.8
20.8
CLDT
Chatham Lodging Trust
17.87
8.0
838.5
33.3
266.3
CLRO
ClearOne, Inc.
1.54
0.0
25.6
-0.9
0.0
CMCT
CIM Commercial Trust Corp.
14.71
98.2
214.8
0.7
64.6
CME
CME Group, Inc.
200.66
2.3
71,855.3
39.0
91.4
CMI
Cummins, Inc.
180.03
3.4
28,406.2
10.9
36.7
CMP
Compass Minerals International, Inc.
58.15
5.0
1,970.4
33.5
165.8
CNA
CNA Financial Corp.
44.25
10.9
11,981.6
18.7
203.3
CNI
Canadian National Railway Co.
89.74
6.4
64,305.5
19.2
123.3
CNK
Cinemark Holdings, Inc.
37.01
3.6
4,335.8
21.3
77.1
CNO
CNO Financial Group, Inc.
15.94
2.6
2,491.2
-6.4
-16.8
CNP
CenterPoint Energy, Inc.
29.14
4.9
14,634.7
25.5
125.0
CNS
Cohen & Steers, Inc. (New York)
63.05
6.2
2,978.5
24.1
149.4
COL
Rockwell Collins, Inc.
0.00
0.0
0.0
COLM
Columbia Sportswear Co.
95.14
1.0
6,427.4
21.1
21.3
COP
ConocoPhillips
55.68
2.4
61,812.6
8.9
21.4
CORE
Core-Mark Holding Co., Inc.
29.34
1.5
1,346.1
24.6
36.8
COST
Costco Wholesale Corp.
298.94
1.0
131,431.1
35.9
37.1
COT
Cott Corp. (Canada)
12.87
4.4
1,735.8
-307.8
-1,339.0
COTY
Coty, Inc.
11.79
2.7
8,892.7
-2.3
-6.2
CPA
Copa Holdings SA
104.87
2.7
4,426.6
106.1
285.6
CPF
Central Pacific Financial Corp.
29.18
3.8
825.9
14.0
53.5
CPG
Crescent Point Energy Corp.
3.94
3.0
2,166.9
-1.3
-4.0
CPSI
Computer Programs & Systems, Inc.
23.21
1.7
333.2
17.8
30.6
CQH
Cheniere Energy Partners LP Holdings, LLC
0.00
0.0
0.0
CR
Crane Co.
75.52
1.8
5,051.8
12.5
22.6
CRI
Carter's, Inc.
99.57
2.0
4,413.0
16.8
32.7
CRS
Carpenter Technology Corp.
50.97
1.6
2,432.3
13.9
21.9
CRT
Cross Timbers Royalty Trust
8.77
12.5
52.6
7.3
92.1
CSB
VictoryShares US Small Cap High Div Volatility Wtd ETF
45.92
0.0
0.0
CSFL
CenterState Bank Corp.
25.12
2.1
3,259.2
13.6
29.0
CSGS
CSG Systems International, Inc.
51.36
1.7
1,682.1
21.9
37.7
CSL
Carlisle Cos., Inc.
155.70
1.1
8,824.0
19.6
21.3
CSPI
CSP, Inc.
13.12
4.6
54.5
-39.9
-182.6
CSS
CSS Industries, Inc.
4.45
9.0
39.4
-0.8
-7.2
CSV
Carriage Services, Inc.
22.99
1.6
405.8
44.1
72.6
CSX
CSX Corp.
71.52
1.6
55,616.6
17.0
28.0
CTB
Cooper Tire & Rubber Co.
30.36
1.7
1,522.8
34.1
58.9
CTL
CenturyLink, Inc.
12.93
10.0
14,103.7
-1.7
-17.4
CTRN
Citi Trends, Inc.
18.14
1.8
216.1
14.7
26.0
CTT
CatchMark Timber Trust, Inc.
11.60
4.7
568.5
-3.2
-14.9
CTWS
Connecticut Water Service, Inc.
69.98
1.8
844.6
39.4
72.1
CUB
Cubic Corp.
72.07
0.4
2,247.0
76.7
28.7
CUK
Carnival Plc
41.71
6.0
7,667.5
9.4
56.4
CVE
Cenovus Energy, Inc.
8.68
3.0
10,690.6
51.5
155.2
CVI
CVR Energy, Inc.
47.11
8.1
4,736.0
11.3
91.4
CVR
Chicago Rivet & Machine Co.
26.00
4.5
25.1
22.7
102.1
CVX
Chevron Corp.
118.48
4.0
224,924.8
15.2
60.3
CWH
Camping World Holdings, Inc.
9.83
6.2
865.8
-20.7
-128.8
CXP
Columbia Property Trust, Inc.
20.16
4.0
2,356.7
-368.6
-1,462.5
CZWI
Citizens Community Bancorp, Inc. (Wisconsin)
11.18
1.8
126.0
16.3
29.2
D
Dominion Energy, Inc.
81.33
4.4
66,846.3
54.6
240.8
DAKT
Daktronics, Inc.
7.15
3.4
321.4
206.1
691.6
DAL
Delta Air Lines, Inc.
55.17
3.4
35,680.8
7.7
26.0
DAN
Dana, Inc.
16.67
3.0
2,404.9
10.7
32.0
DBD
Diebold Nixdorf, Inc.
7.74
0.0
758.3
-1.1
0.0
DCI
Donaldson Co., Inc.
53.60
1.5
6,764.1
25.8
38.4
DEA
Easterly Government Properties, Inc.
22.03
4.7
1,762.6
198.3
936.1
DF
Dean Foods Co.
1.11
2.7
102.0
-0.2
-0.7
DFS
Discover Financial Services
81.43
2.6
25,650.5
9.2
23.5
DHI
D.R. Horton, Inc.
51.82
1.2
19,164.1
12.3
14.2
DHXM
DHX Media Ltd.
1.44
0.0
246.1
-2.7
0.0
DIT
AMCON Distributing Co.
74.10
1.6
43.9
10.2
16.2
DK
Delek US Holdings, Inc.
40.05
2.8
2,990.8
6.2
17.1
DKS
Dick's Sporting Goods, Inc.
38.99
2.7
3,542.8
11.5
30.9
DLR
Digital Realty Trust, Inc.
132.28
3.2
27,559.6
121.2
389.4
DLX
Deluxe Corp.
53.75
2.8
2,263.0
-12.3
-34.2
DNB
The Dun & Bradstreet Corporation
0.00
0.0
0.0
DNBF
DNB Financial Corp. (Pennsylvania)
45.67
0.8
198.0
17.9
13.7
DNKN
Dunkin' Brands Group, Inc.
73.69
2.0
6,096.2
26.4
52.7
DOV
Dover Corp.
104.21
1.9
15,138.2
23.3
43.1
DPZ
Domino's Pizza, Inc.
266.84
1.2
11,021.8
28.6
33.4
DRD
DRDGOLD Ltd.
4.75
2.8
318.8
59.8
169.6
DRYS
DryShips, Inc.
5.24
0.0
455.3
99.1
0.0
DUK
Duke Energy Corp.
94.10
8.0
68,561.4
20.8
165.7
DVN
Devon Energy Corp.
21.05
2.0
8,508.4
2.6
5.3
DWDP
DowDuPont, Inc.
30.52
5.0
68,559.8
21.5
107.0
EAT
Brinker International, Inc.
44.20
3.5
1,632.1
10.9
37.8
EBIX
Ebix, Inc.
43.82
0.7
1,341.2
14.7
10.0
EBMT
Eagle Bancorp Montana, Inc.
18.89
2.5
121.0
11.8
29.3
EBTC
Enterprise Bancorp, Inc.
30.34
2.6
358.5
11.2
28.9
ECA
Encana Corp.
4.16
1.7
5,614.7
3.6
6.1
ECC
Eagle Point Credit Co., Inc.
15.53
18.0
377.6
-14.1
-254.3
ED
Consolidated Edison, Inc.
91.09
4.0
30,255.0
21.5
86.8
EE
El Paso Electric Co.
67.01
2.8
2,733.4
30.2
84.6
EFSC
Enterprise Financial Services Corp.
44.34
1.7
1,180.0
12.8
21.6
EFX
Equifax, Inc.
136.69
1.1
16,550.8
-43.1
-49.2
EGOV
NIC, Inc.
20.36
1.6
1,363.3
26.5
41.7
EGP
EastGroup Properties, Inc.
133.15
2.2
5,001.0
54.2
118.4
EIG
Employers Holdings, Inc.
41.93
2.6
1,334.0
9.0
23.1
EL
The Estée Lauder Companies, Inc.
185.71
0.9
67,064.3
37.8
35.0
ELY
Callaway Golf Co.
20.95
0.2
1,978.8
33.8
6.4
EMCI
EMC Insurance Group, Inc.
36.01
2.6
780.5
24.0
61.3
EML
The Eastern Co.
28.02
1.6
174.7
14.3
22.4
EMR
Emerson Electric Co.
70.99
2.8
43,666.0
20.0
55.1
ENB
Enbridge, Inc.
36.64
13.8
74,153.1
21.4
294.3
ENR
Energizer Holdings, Inc.
42.94
2.8
2,965.5
370.1
1,032.0
ENS
EnerSys
69.24
1.0
2,941.5
18.0
18.2
EPM
Evolution Petroleum Corp.
5.75
7.0
190.1
12.4
86.2
EPR
EPR Properties
78.29
6.2
6,071.9
23.1
142.7
EQIX
Equinix, Inc.
567.13
1.7
48,103.4
93.4
159.1
EQT
EQT Corp.
9.32
1.6
2,406.8
-6.6
-10.5
ERF
Enerplus Corp.
6.16
2.1
1,420.7
4.4
9.4
ES
Eversource Energy
83.85
2.5
27,134.0
30.9
77.8
ESBK
Elmira Savings Bank
14.23
6.5
49.6
14.3
92.3
ESCA
Escalade, Inc.
11.47
4.4
165.9
17.8
77.7
ESP
Espey Manufacturing & Electronics Corp.
22.09
4.5
53.0
22.5
101.6
ESRT
Empire State Realty Trust, Inc.
14.28
2.9
2,572.7
45.1
132.6
ESSA
ESSA Bancorp, Inc.
16.30
2.5
186.0
13.8
34.0
ESV
Ensco Rowan Plc
8.19
2.0
1,569.5
-1.3
-2.5
ETM
Entercom Communications Corp.
3.47
8.3
496.3
-1.5
-12.4
ETN
Eaton Corp. Plc
87.22
4.0
36,632.4
16.9
67.7
ETR
Entergy Corp.
118.12
6.2
23,485.8
22.8
142.3
EVC
Entravision Communications Corp.
2.79
7.2
237.1
-39.3
-281.7
EVR
Evercore, Inc.
76.12
3.6
3,035.1
8.6
31.0
EXC
Exelon Corp.
45.60
3.1
44,304.2
19.4
61.1
EXPE
Expedia Group, Inc.
138.09
0.9
20,060.1
33.3
31.3
EXPO
Exponent, Inc.
63.83
1.2
3,314.0
42.4
51.1
EXR
Extra Space Storage, Inc.
112.07
3.1
15,177.9
33.0
103.7
F
Ford Motor Co.
8.61
7.0
34,139.1
20.9
145.8
FAF
First American Financial Corp.
61.41
2.7
6,888.4
12.1
33.1
FBHS
Fortune Brands Home & Security, Inc.
60.67
1.8
8,486.6
FBNK
FaceBank Group, Inc.
10.18
0.0
254.8
-5.5
0.0
FCAP
First Capital, Inc.
61.04
1.5
205.3
19.5
30.1
FCBC
First Community Bancshares, Inc. (Virginia)
32.45
3.6
505.6
13.3
48.1
FDP
Fresh Del Monte Produce, Inc.
28.55
0.7
1,380.6
74.5
54.8
FDS
FactSet Research Systems, Inc.
257.89
1.1
9,865.8
FE
FirstEnergy Corp.
47.27
4.0
25,525.2
22.7
90.5
FF
FutureFuel Corp.
12.63
2.3
559.5
27.0
63.3
FFBC
First Financial Bancorp (Ohio)
23.87
4.6
2,415.0
11.4
52.7
FFG
FBL Financial Group, Inc.
57.46
5.9
2,833.9
13.8
81.4
FFIC
Flushing Financial Corp.
21.80
3.8
614.5
13.1
49.7
FFNW
First Financial Northwest, Inc.
14.11
5.0
145.3
14.3
71.1
FGBI
First Guaranty Bancshares, Inc.
21.55
3.0
189.8
15.4
45.6
FIS
Fidelity National Information Services, Inc.
130.22
1.3
79,882.7
56.0
74.0
FIX
Comfort Systems USA, Inc.
50.95
1.0
1,862.8
17.8
17.0
FLIR
FLIR Systems, Inc.
54.77
1.2
7,427.1
26.8
32.8
FLO
Flowers Foods, Inc.
21.57
3.4
4,562.4
25.4
87.2
FMNB
Farmers National Banc Corp.
14.88
2.4
411.7
11.9
28.8
FNB
F.N.B. Corp. (Pennsylvania)
12.32
4.9
4,005.8
10.4
50.8
FNF
Fidelity National Financial, Inc.
44.98
2.7
12,324.1
16.4
44.8
FNHC
FedNat Holding Co.
14.49
2.2
191.6
98.7
218.0
FNV
Franco-Nevada Corp.
93.61
2.4
17,618.3
116.6
283.5
FORR
Forrester Research, Inc.
34.93
0.6
648.0
-71.0
-40.6
FRME
First Merchants Corp. (Indiana)
39.63
2.4
2,193.4
12.5
30.2
FSFG
First Savings Financial Group, Inc.
61.87
1.0
145.4
9.9
10.1
FSS
Federal Signal Corp.
34.86
0.9
2,106.4
20.0
18.4
FTAI
Fortress Transportation & Infrastructure Investors LLC
15.98
8.3
1,355.8
69.9
577.7
FTV
Fortive Corp.
68.64
0.4
23,049.6
8.9
3.6
FWRD
Forward Air Corp.
71.08
1.3
2,002.5
22.5
28.5
G
Genpact Ltd.
38.29
1.1
7,315.2
25.3
27.3
GARS
Garrison Capital, Inc.
6.68
13.8
107.2
-40.6
-559.6
GATX
GATX Corp.
81.29
4.5
2,902.1
14.4
65.1
GBL
GAMCO Investors, Inc.
15.98
0.5
442.6
4.4
2.2
GBNK
Guaranty Bancorp
0.00
0.0
0.0
GCAP
GAIN Capital Holdings, Inc.
4.28
7.0
160.2
-5.0
-35.2
GCI
Gannett Co., Inc.
11.21
7.1
1,285.5
92.2
657.9
GFF
Griffon Corp.
21.07
1.4
986.1
-119.4
-164.3
GFI
Gold Fields Ltd.
5.61
0.9
4,764.6
51.8
49.0
GG
0.00
0.0
0.0
GGB
Gerdau SA
3.28
2.9
3,645.8
10.9
31.6
GHL
Greenhill & Co., Inc.
15.87
1.3
323.4
-60.6
-76.4
GILD
Gilead Sciences, Inc.
63.73
7.8
80,682.2
30.2
235.9
GLOG
GasLog Ltd.
14.62
6.8
1,179.5
-78.8
-539.2
GLPI
Gaming & Leisure Properties, Inc.
39.43
6.9
8,465.0
25.1
173.4
GLW
Corning, Inc.
30.61
3.2
23,902.3
17.2
55.0
GM
General Motors Co.
36.64
4.1
52,312.0
5.8
23.9
GME
GameStop Corp.
6.15
12.3
559.9
-0.5
-6.7
GNE
Genie Energy Ltd.
7.54
4.0
205.4
12.7
50.7
GNL
Global Net Lease, Inc.
19.41
11.0
1,639.9
159.5
1,750.2
GOOD
Gladstone Commercial Corp.
22.59
7.7
719.8
424.6
3,289.5
GORO
Gold Resource Corp.
3.96
0.6
259.7
89.2
52.5
GPI
Group 1 Automotive, Inc.
103.67
1.0
1,925.3
GPN
Global Payments, Inc.
162.20
0.0
48,667.6
52.7
1.3
GPRE
Green Plains, Inc.
12.12
3.0
462.8
-10.3
-30.6
GRA
W.R. Grace & Co.
67.16
2.0
4,482.0
20.1
39.4
GRC
The Gorman-Rupp Co.
36.97
8.4
966.1
26.2
221.1
GRMN
Garmin Ltd.
87.65
3.8
16,662.4
22.4
85.4
GROW
U.S. Global Investors, Inc.
2.05
1.7
31.0
-9.2
-15.6
GS
The Goldman Sachs Group, Inc.
217.75
2.3
78,294.8
9.6
21.9
GSB
GlobalSCAPE, Inc.
9.46
5.6
163.9
GT
Goodyear Tire & Rubber Co.
16.51
4.8
3,902.4
20.2
96.2
GWRS
Global Water Resources, Inc.
12.15
2.4
261.7
132.8
312.7
GWW
W.W. Grainger, Inc.
316.39
1.8
17,042.7
18.4
32.5
H
Hyatt Hotels Corp.
73.55
1.0
7,655.7
18.6
18.4
HAL
Halliburton Co.
20.30
3.5
17,819.4
15.0
53.0
HAYN
Haynes International, Inc.
34.73
2.5
434.6
75.4
191.0
HBI
Hanesbrands, Inc.
16.01
4.7
5,788.3
10.3
48.2
HBM
HudBay Minerals, Inc.
3.78
0.5
1,000.7
-20.4
-10.7
HCA
HCA Healthcare, Inc.
126.87
1.2
43,260.5
12.0
14.6
HCAP
Harvest Capital Credit Corp.
9.85
10.2
59.8
27.0
275.8
HCC
Warrior Met Coal, Inc.
22.85
20.4
1,177.4
1.8
36.8
HCFT
Hunt Companies Finance Trust, Inc.
3.33
8.4
78.9
35.6
299.1
HCI
HCI Group, Inc.
40.84
4.8
334.1
21.8
105.3
HCP
HCP, Inc.
36.15
5.1
17,753.6
17.5
89.7
HCSG
Healthcare Services Group, Inc.
25.67
3.8
1,902.5
24.7
94.9
HD
The Home Depot, Inc.
236.80
2.2
259,331.5
23.5
50.6
HE
Hawaiian Electric Industries, Inc.
44.51
2.8
4,863.5
23.8
67.7
HEES
H&E Equipment Services, Inc.
34.90
3.2
1,251.1
13.8
43.6
HES
Hess Corp.
66.57
1.5
20,269.3
-416.1
-625.0
HFC
HollyFrontier Corp.
58.25
2.3
9,586.7
10.8
24.4
HGT
Hugoton Royalty Trust
0.00
0.0
0.0
HI
Hillenbrand, Inc.
31.82
2.6
1,994.1
14.2
37.4
HII
Huntington Ingalls Industries, Inc.
222.69
1.5
9,204.9
13.8
21.3
HIW
Highwoods Properties, Inc.
45.65
5.2
4,735.9
37.1
191.8
HL
Hecla Mining Co.
2.07
0.5
1,034.4
-8.3
-3.9
HLI
Houlihan Lokey, Inc.
46.98
3.1
3,095.8
17.6
55.1
HLT
Hilton Worldwide Holdings, Inc.
97.19
0.8
27,423.4
30.3
23.4
HMN
Horace Mann Educators Corp.
44.95
2.6
1,844.4
15.9
40.7
HNI
HNI Corp.
38.64
3.1
1,656.7
17.5
54.5
HNNA
Hennessy Advisors, Inc.
11.18
4.2
83.8
7.1
29.9
HOFT
Hooker Furniture Corp.
23.17
2.6
274.4
9.1
23.5
HOG
Harley-Davidson, Inc.
40.35
3.7
6,324.1
15.6
57.7
HOMB
Home Bancshares, Inc. (Arkansas)
18.67
3.3
3,152.0
11.0
36.7
HON
Honeywell International, Inc.
172.68
2.4
123,385.6
19.9
48.2
HP
Helmerich & Payne, Inc.
39.64
9.0
4,338.0
-58.0
-519.7
HPP
Hudson Pacific Properties, Inc.
34.45
2.9
10,635.0
1,510.7
4,396.8
HR
Healthcare Realty Trust, Inc.
33.95
3.5
4,387.9
140.2
495.7
HRC
Hill-Rom Holdings, Inc.
98.58
0.8
6,716.3
30.6
25.3
HRS
Harris Corp.
189.13
1.4
22,341.2
24.9
34.6
HSY
The Hershey Co.
141.15
2.6
29,489.3
22.5
59.2
HTGC
Hercules Capital, Inc.
13.71
9.6
1,430.0
10.4
99.2
HTLF
Heartland Financial USA, Inc.
46.84
1.9
1,718.8
HUBB
Hubbell, Inc.
140.20
5.0
7,628.1
20.7
103.5
HUN
Huntsman Corp.
22.49
2.9
5,211.3
15.1
43.2
HVT
Haverty Furniture Cos., Inc.
21.09
8.3
415.6
15.8
130.0
HWC
Hancock Whitney Corp.
40.16
5.4
3,643.1
10.5
56.6
HY
Hyster-Yale Materials Handling, Inc.
52.23
2.4
668.0
25.7
61.7
IBKR
Interactive Brokers Group, Inc.
47.42
1.0
23,471.5
22.4
23.5
IBM
International Business Machines Corp.
135.97
4.7
120,452.4
15.7
73.7
ICBK
County Bancorp, Inc. (Manitowoc, Wisconsin)
22.27
1.0
149.8
9.7
9.6
ICE
Intercontinental Exchange, Inc.
91.60
1.5
51,334.0
25.7
37.6
ICL
ICL-Israel Chemicals Ltd.
4.54
16.8
5,889.6
11.4
192.1
IDT
IDT Corp.
7.06
0.0
187.1
11,766.7
0.0
IIIN
Insteel Industries, Inc.
19.79
0.6
381.2
68.0
41.2
INTC
Intel Corp.
56.76
2.7
246,906.0
13.1
36.1
IP
International Paper Co.
43.20
5.8
16,970.5
10.9
63.3
IPG
Interpublic Group of Cos., Inc.
22.17
4.1
8,596.0
13.1
53.9
IPHS
Innophos Holdings, Inc.
32.48
5.9
639.6
22.0
129.8
IR
Ingersoll-Rand Plc
122.08
2.2
29,491.7
20.9
45.4
ITIC
Investors Title Co.
168.97
7.2
319.2
13.9
100.6
ITUB
Itaú Unibanco Holding SA
9.19
8.1
44,356.7
13.2
106.8
IVZ
Invesco Ltd.
17.34
8.8
15,741.0
14.9
131.2
JACK
Jack in the Box, Inc.
83.50
1.9
2,156.3
24.2
46.4
JBL
Jabil, Inc.
37.14
1.1
5,654.4
20.3
21.9
JBT
John Bean Technologies Corp.
108.07
0.4
3,445.3
26.5
9.7
JCOM
j2 Global, Inc.
94.71
1.4
4,636.8
31.4
44.2
JE
Just Energy Group, Inc.
2.43
15.4
365.3
-1.3
-20.4
JEC
Jacobs Engineering Group, Inc.
94.41
0.7
12,792.4
-53.7
-38.7
JKHY
Jack Henry & Associates, Inc.
140.75
1.1
10,830.7
39.9
44.6
JMP
JMP Group LLC
3.35
6.6
64.7
-95.4
-626.8
JNJ
Johnson & Johnson
129.18
3.6
340,928.0
JNPR
Juniper Networks, Inc.
25.15
3.7
8,697.3
23.5
87.9
JRVR
James River Group Holdings Ltd.
35.11
3.4
1,065.3
14.2
48.6
JWN
Nordstrom, Inc.
38.04
3.9
5,893.0
12.5
48.5
K
Kellogg Co.
61.06
4.6
20,799.0
24.2
111.9
KELYA
Kelly Services, Inc.
24.13
1.2
949.9
8.3
10.2
KEQU
Kewaunee Scientific Corp.
15.21
5.0
41.8
70.4
351.5
KEY
KeyCorp
18.38
3.8
18,169.3
11.3
42.7
KFRC
Kforce, Inc.
39.55
1.8
959.3
18.3
33.3
KHC
The Kraft Heinz Co.
28.37
6.4
34,611.1
-3.1
-20.0
KINS
Kingstone Cos., Inc.
8.05
4.5
86.7
-33.1
-148.9
KKR
KKR & Co., Inc.
28.70
1.7
24,182.2
10.5
18.3
KLAC
KLA Corp.
174.78
1.7
27,696.2
23.1
39.7
KMG
KMG Chemicals, Inc.
0.00
0.0
0.0
KMPR
Kemper Corp.
73.58
1.3
4,917.1
12.8
17.1
KNL
Knoll, Inc.
26.40
2.4
1,314.1
15.8
38.2
KNX
Knight-Swift Transportation Holdings, Inc.
37.43
0.6
6,459.0
16.5
10.4
KR
The Kroger Co.
25.33
2.9
20,305.1
12.4
36.1
KRNY
Kearny Financial Corp.
13.74
1.7
1,203.6
29.2
48.9
KRO
Kronos Worldwide, Inc.
12.63
7.0
1,462.6
12.6
88.6
KSS
Kohl's Corp.
53.71
4.9
8,546.7
11.8
57.4
L
Loews Corp.
49.42
0.5
14,943.6
27.5
13.9
LABL
Multi-Color Corp.
50.01
0.3
1,027.4
-35.7
-10.7
LAD
Lithia Motors, Inc.
157.60
0.9
3,617.5
13.9
13.1
LAMR
Lamar Advertising Co.
81.25
4.7
8,135.5
22.5
105.6
LANC
Lancaster Colony Corp.
136.14
1.9
3,742.9
24.9
47.5
LAND
Gladstone Land Corp.
11.96
5.2
248.9
LARK
Landmark Bancorp, Inc. (Kansas)
22.90
3.5
100.2
9.8
34.1
LB
L Brands, Inc.
17.95
8.4
4,961.2
8.6
71.7
LBY
Libbey, Inc.
2.17
0.0
49.4
-0.9
0.0
LCNB
LCNB Corp.
18.10
3.8
234.0
12.4
46.5
LDOS
Leidos Holdings, Inc.
80.81
3.3
11,621.1
18.0
59.3
LEA
Lear Corp.
123.57
2.4
7,459.6
9.0
21.5
LFUS
Littelfuse, Inc.
187.62
0.9
4,646.4
28.0
26.2
LKSD
LSC Communications, Inc.
1.14
68.4
38.2
-0.2
-15.3
LLL
L3 Technologies, Inc.
245.17
1.0
19,479.0
22.7
23.1
LLY
Eli Lilly & Co.
112.99
2.8
108,485.2
25.4
70.6
LMT
Lockheed Martin Corp.
371.84
3.0
104,885.3
17.5
52.9
LOB
Live Oak Bancshares, Inc.
18.71
0.6
747.9
34.7
22.4
LPLA
LPL Financial Holdings, Inc.
80.21
1.6
6,602.0
12.1
18.9
LRCX
Lam Research Corp.
281.25
1.6
40,745.0
19.9
31.4
LSTR
Landstar System, Inc.
117.96
0.7
4,674.7
19.2
14.1
LTC
LTC Properties, Inc.
51.16
5.2
2,033.7
19.1
99.1
LUV
Southwest Airlines Co.
57.64
1.2
30,982.5
12.9
15.2
LVS
Las Vegas Sands Corp.
62.40
6.1
48,034.8
25.3
155.5
LW
Lamb Weston Holdings, Inc.
76.03
1.3
11,105.2
23.4
30.5
LYB
LyondellBasell Industries NV
91.34
4.5
30,621.4
9.6
42.9
LZB
La-Z-Boy, Inc.
35.56
1.5
1,658.3
24.4
35.7
MAC
Macerich Co.
28.45
13.2
4,315.3
37.1
488.7
MAIN
Main Street Capital Corp.
43.10
7.8
2,721.1
16.8
131.7
MANT
ManTech International Corp.
69.20
1.5
2,778.6
31.5
48.0
MAR
Marriott International, Inc.
126.60
1.4
41,696.8
28.7
40.4
MARPS
Marine Petroleum Trust
2.22
14.5
4.4
7.0
101.3
MATX
Matson, Inc.
39.63
4.4
1,698.3
18.2
79.4
MBCN
Middlefield Banc Corp.
46.46
2.4
149.2
11.6
27.9
MBFI
0.00
0.0
0.0
MBWM
Mercantile Bank Corp.
35.06
5.9
572.6
12.1
71.1
MC
Moelis & Co.
32.05
10.0
2,327.8
13.3
133.5
MCD
McDonald's Corp.
191.78
3.1
145,646.2
MCHP
Microchip Technology, Inc.
95.59
1.5
22,754.6
60.9
93.1
MCHX
Marchex, Inc.
3.28
0.0
141.1
-41.3
0.0
MCO
Moody's Corp.
216.29
1.1
40,922.1
33.1
37.4
MCS
Marcus Corp.
36.11
1.7
1,116.5
MCY
Mercury General Corp.
47.31
10.6
2,618.8
12.7
134.8
MDP
Meredith Corp.
37.74
6.0
1,707.0
-53.5
-321.9
MEOH
Methanex Corp.
37.90
3.6
2,959.5
7.8
27.8
MET
MetLife, Inc.
46.81
4.6
43,835.1
7.6
35.2
MFC
Manulife Financial Corp.
19.11
5.3
37,112.1
8.8
46.6
MFSF
MutualFirst Financial, Inc.
32.84
2.4
279.1
12.6
30.6
MGA
Magna International, Inc.
54.70
6.1
17,022.0
7.0
42.7
MGEE
MGE Energy, Inc.
75.91
2.3
2,631.6
30.8
69.7
MGIC
Magic Software Enterprises Ltd.
9.36
3.3
457.6
23.1
75.6
MGM
MGM Resorts International
28.55
1.8
14,886.7
81.4
145.4
MGPI
MGP Ingredients, Inc.
48.75
0.8
830.0
21.7
16.9
MIC
Macquarie Infrastructure Corp.
39.67
10.1
3,422.0
33.4
336.6
MINI
Mobile Mini, Inc.
38.59
2.8
1,718.9
-284.0
-793.7
MIXT
MiX Telematics Ltd.
12.81
1.9
289.0
16.1
30.4
MKSI
MKS Instruments, Inc.
113.93
0.7
6,251.1
36.7
25.6
MLAB
Mesa Laboratories, Inc.
227.97
0.4
993.5
112.7
39.6
MLI
Mueller Industries, Inc.
30.86
1.3
1,757.5
17.3
22.5
MLM
Martin Marietta Materials, Inc.
269.05
0.7
16,799.5
33.3
24.7
MLR
Miller Industries, Inc. (Tennessee)
34.50
2.1
393.3
10.1
21.1
MMM
3M Co.
169.06
3.4
97,218.1
19.8
66.4
MNDO
MIND C.T.I. Ltd.
2.33
11.2
46.2
8.5
94.6
MNR
Monmouth Real Estate Investment Corp.
14.71
5.8
1,404.3
-387.1
-2,236.8
MNRO
Monro, Inc.
70.98
1.2
2,358.2
MOFG
MidWestOne Financial Group, Inc.
32.00
3.1
517.8
11.9
37.2
MOS
The Mosaic Co.
20.58
1.0
7,941.1
30.8
29.9
MPC
Marathon Petroleum Corp.
67.58
3.0
44,489.2
14.4
43.8
MPX
Marine Products Corp.
13.05
6.0
444.3
15.2
90.8
MRO
Marathon Oil Corp.
11.94
1.7
9,600.3
10.1
16.9
MRTN
Marten Transport Ltd.
22.56
3.4
1,223.9
20.2
68.9
MSA
MSA Safety, Inc.
117.39
2.8
4,547.5
34.9
97.4
MSCI
MSCI, Inc.
225.03
1.1
19,059.8
33.4
35.9
MSEX
Middlesex Water Co.
64.78
1.9
1,073.3
31.4
59.0
MSFT
Microsoft Corp.
144.19
1.6
1,099,998.1
26.9
43.8
MTB
M&T Bank Corp.
158.66
2.5
20,990.5
11.4
28.7
MTEX
Mannatech, Inc.
16.29
5.4
39.0
-68.3
-367.0
MTRN
Materion Corp.
57.29
0.9
1,168.9
77.7
73.2
MTX
Minerals Technologies, Inc.
53.18
0.5
1,874.1
12.4
5.8
MUR
Murphy Oil Corp.
19.42
6.3
3,196.3
10.1
64.2
MXIM
Maxim Integrated Products, Inc.
57.98
3.2
15,718.1
19.2
61.7
NAO
Hermitage Offshore Services Ltd.
3.47
8.6
65.0
-0.1
-1.0
NAT
Nordic American Tankers Ltd.
3.74
4.8
534.8
-9.2
-44.0
NATI
National Instruments Corp.
40.95
2.4
5,400.7
35.7
85.5
NAVG
The Navigators Group, Inc.
69.96
0.3
2,096.7
1,231.7
369.7
NAVI
Navient Corp.
13.94
4.6
3,080.7
6.7
30.5
NBHC
National Bank Holdings Corp.
34.74
2.1
1,082.8
13.8
28.7
NBTB
NBT Bancorp, Inc.
38.03
2.7
1,664.8
13.8
37.7
NC
NACCO Industries, Inc.
63.22
1.1
441.9
10.2
11.4
NCMI
National CineMedia, Inc.
8.59
7.9
2,001.8
18.7
148.4
NDAQ
Nasdaq, Inc.
98.73
2.3
16,259.6
30.9
71.8
NDRO
Enduro Royalty Trust
0.00
0.0
0.0
NDSN
Nordson Corp.
156.02
0.9
8,969.6
28.0
25.6
NEE
NextEra Energy, Inc.
233.23
2.6
113,997.2
34.8
91.1
NEM
Newmont Goldcorp Corp.
38.85
4.1
31,852.9
-285.7
-1,161.8
NEWM
New Media Investment Group, Inc.
9.37
20.3
566.7
628.9
12,751.7
NEWT
Newtek Business Services Corp.
21.94
12.1
420.4
11.0
133.1
NHC
National HealthCare Corp.
80.37
2.5
1,231.2
16.5
41.9
NHTC
Natural Health Trends Corp.
6.78
8.6
73.1
6.6
56.5
NLSN
Nielsen Holdings Plc
20.95
6.7
7,451.4
-10.8
-72.2
NNA
Navios Maritime Acquisition Corp.
8.14
11.3
1,163.1
-1.6
-18.2
NNBR
NN, Inc.
6.71
4.2
284.3
-1.1
-4.4
NNI
Nelnet, Inc.
61.47
1.2
2,439.3
19.1
22.4
NOC
Northrop Grumman Corp.
346.53
1.5
58,401.7
17.8
25.9
NOV
National Oilwell Varco, Inc.
20.96
1.0
8,088.4
-1.5
-1.4
NP
Neenah, Inc.
63.02
2.8
1,062.6
20.8
58.1
NPK
National Presto Industries, Inc.
83.83
7.2
586.4
16.8
120.3
NPO
EnPro Industries, Inc.
71.56
1.4
1,473.7
43.5
60.1
NRE
NorthStar Realty Europe Corp.
17.02
3.5
855.9
4.7
16.5
NRIM
Northrim BanCorp, Inc.
37.53
3.2
250.4
13.8
44.1
NSA
National Storage Affiliates Trust
34.78
3.6
3,213.5
-146.1
-521.0
NSC
Norfolk Southern Corp.
187.76
2.3
48,957.9
18.2
42.5
NSP
Insperity, Inc.
103.15
1.1
4,252.5
25.8
27.4
NTES
NetEase, Inc.
283.67
0.9
36,298.6
28.4
26.6
NTRI
0.00
0.0
0.0
NUS
Nu Skin Enterprises, Inc.
44.76
3.3
2,486.3
19.9
65.7
NVDA
NVIDIA Corp.
206.79
0.3
125,935.1
45.9
14.2
NWE
NorthWestern Corp.
72.64
3.1
3,664.2
17.0
53.3
NWL
Newell Brands, Inc.
19.48
3.5
8,247.8
-1.2
-4.3
NX
Quanex Building Products Corp.
18.99
1.7
629.7
-65.5
-110.4
NXRT
NexPoint Residential Trust, Inc.
47.48
2.3
1,138.0
-63.4
-147.0
NXST
Nexstar Media Group, Inc.
103.64
3.4
4,780.1
12.6
42.8
NYLD
Clearway Energy, Inc.
0.00
0.0
0.0
O
Realty Income Corp.
80.88
3.6
25,738.3
61.7
223.2
OCSI
Oaktree Strategic Income Corp.
8.11
7.6
239.0
19.4
148.1
OCSL
Oaktree Specialty Lending Corp.
5.17
7.4
728.8
5.0
36.8
ODC
Oil-Dri Corp. of America
33.73
3.6
256.6
18.6
67.3
ODFL
Old Dominion Freight Line, Inc.
187.37
0.4
14,990.8
24.0
10.4
ODP
Office Depot, Inc.
2.09
4.8
1,141.9
38.8
185.5
OEC
Orion Engineered Carbons SA
16.83
5.9
1,022.4
11.4
67.1
OGS
ONE Gas, Inc.
93.32
2.1
4,921.2
27.3
57.4
OLBK
Old Line Bancshares, Inc.
29.31
1.6
498.2
13.6
21.3
OLED
Universal Display Corp.
176.06
0.2
8,290.4
71.3
14.6
OLN
Olin Corp.
19.12
5.1
3,190.7
11.8
60.7
OMI
Owens & Minor, Inc.
7.24
1.1
455.8
-1.5
-1.7
ONB
Old National Bancorp
18.13
3.6
3,086.1
13.2
47.3
OPOF
Old Point Financial Corp.
24.10
2.0
125.4
17.2
33.6
ORA
Ormat Technologies, Inc.
74.26
0.6
3,788.2
42.5
24.6
ORC
Orchid Island Capital, Inc.
5.61
18.5
353.8
-15.4
-285.4
ORI
Old Republic International Corp.
22.24
8.1
6,743.2
9.9
79.6
OSB
Norbord, Inc.
28.60
11.0
2,336.6
28.7
315.8
OTEX
Open Text Corp.
40.30
3.8
10,889.6
37.9
143.4
OTTR
Otter Tail Corp.
55.01
2.5
2,186.9
27.5
69.4
OUT
OUTFRONT Media, Inc.
26.53
6.8
3,802.9
23.6
160.1
OXSQ
Oxford Square Capital Corp.
5.88
17.1
280.2
-12.5
-213.1
PAAS
Pan American Silver Corp.
16.06
0.9
3,399.9
-79.7
-68.7
PAG
Penske Automotive Group, Inc.
49.92
3.9
4,117.6
9.4
36.6
PAHC
Phibro Animal Health Corp.
23.18
2.1
937.7
17.1
35.5
PBA
Pembina Pipeline Corp.
35.45
6.6
18,132.7
15.4
101.8
PBF
PBF Energy, Inc.
32.88
3.6
3,954.1
166.2
604.8
PBI
Pitney Bowes, Inc.
5.37
6.3
909.2
5.9
37.3
PBIP
Prudential Bancorp, Inc.
17.62
3.7
156.6
16.6
61.2
PBT
Permian Basin Royalty Trust
4.05
12.3
188.8
8.2
100.8
PCAR
PACCAR, Inc.
77.51
4.6
26,795.2
11.1
50.8
PCH
PotlatchDeltic Corp.
43.01
3.7
2,889.7
63.0
234.5
PDM
Piedmont Office Realty Trust, Inc.
21.07
4.0
2,650.2
22.2
88.4
PEBK
Peoples Bancorp of North Carolina, Inc.
30.05
2.2
177.7
12.3
26.6
PEG
Public Service Enterprise Group, Inc.
62.19
3.0
31,445.5
21.4
64.1
PEI
Pennsylvania Real Estate Investment Trust
6.24
13.5
483.9
-3.5
-46.7
PEP
PepsiCo, Inc.
136.57
2.8
190,437.3
15.5
42.7
PFBI
Premier Financial Bancorp, Inc.
17.62
3.4
258.0
10.7
36.5
PFE
Pfizer Inc.
37.28
4.8
206,197.5
16.7
79.8
PFG
Principal Financial Group, Inc.
55.08
7.9
15,312.2
10.3
81.5
PFIN
P&F Industries, Inc.
6.65
3.0
20.9
3.5
10.4
PFIS
Peoples Financial Services Corp.
49.20
5.6
363.5
13.4
75.1
PFLT
PennantPark Floating Rate Capital Ltd.
11.51
9.9
446.3
29.6
293.6
PH
Parker-Hannifin Corp.
190.37
2.2
24,462.4
16.4
35.7
PHX
Panhandle Oil & Gas, Inc.
14.28
1.1
234.0
15.1
16.9
PII
Polaris Industries Inc.
100.95
3.0
6,175.4
19.6
59.0
PKOH
Park-Ohio Holdings Corp.
31.89
1.6
398.0
8.2
12.8
PLD
Prologis, Inc.
85.89
2.4
54,260.5
30.4
73.3
PLOW
Douglas Dynamics, Inc.
46.21
2.3
1,053.4
21.4
50.1
PLT
Plantronics, Inc.
39.46
1.5
1,561.7
-7.9
-12.1
PMD
Psychemedics Corp.
9.32
9.7
51.4
17.4
168.0
PNW
Pinnacle West Capital Corp.
92.23
4.0
10,357.8
20.6
83.2
POOL
Pool Corp.
199.77
1.0
7,966.0
30.6
30.6
POPE
Pope Resources LP
75.84
5.3
330.3
52.8
278.7
POWI
Power Integrations, Inc.
94.90
0.9
2,792.1
47.9
43.4
POWL
Powell Industries, Inc.
38.94
2.7
448.7
92.1
247.0
PPG
PPG Industries, Inc.
123.71
2.0
29,252.8
24.3
48.3
PRGO
Perrigo Co. Plc
53.99
1.5
7,345.6
83.8
124.2
PRGS
Progress Software Corp.
39.63
2.0
1,785.6
35.9
70.6
PRI
Primerica, Inc.
127.76
1.0
5,352.8
15.8
15.7
PRK
Park National Corp.
98.90
4.2
1,623.3
15.1
64.1
PROV
Provident Financial Holdings, Inc.
20.26
2.8
151.5
34.3
94.8
PRU
Prudential Financial, Inc.
93.12
4.2
37,434.2
9.3
39.1
PSA
Public Storage
232.60
3.4
40,611.5
27.7
95.4
PSB
PS Business Parks, Inc.
182.61
2.9
5,010.3
44.4
127.6
PSX
Phillips 66
117.25
3.7
52,645.3
11.7
43.0
PTEN
Patterson-UTI Energy, Inc.
8.80
2.2
1,805.2
-3.4
-7.5
PTVCA
Protective Insurance Corp.
15.40
3.8
221.6
-7.0
-26.5
PTVCB
Protective Insurance Corp.
16.06
3.6
231.1
-7.3
-26.5
PVH
PVH Corp.
89.67
0.2
6,648.5
10.0
1.7
PWOD
Penns Woods Bancorp, Inc.
30.61
6.1
215.4
12.7
77.7
PX
Praxair, Inc.
0.00
0.0
0.0
PZN
Pzena Investment Management, Inc.
8.59
7.1
601.9
12.3
87.4
QCOM
QUALCOMM, Inc.
83.05
3.7
100,960.6
29.1
108.8
QUAD
Quad/Graphics, Inc.
10.84
11.1
572.3
-15.5
-171.4
R
Ryder System, Inc.
55.12
5.0
2,939.8
9.2
45.5
RBA
Ritchie Bros. Auctioneers, Inc.
40.68
1.8
4,364.8
33.8
61.8
RCKY
Rocky Brands, Inc.
28.01
1.9
207.4
13.0
24.1
RDN
Radian Group Inc.
24.83
0.0
5,049.5
8.5
0.3
RE
Everest Re Group Ltd.
247.02
2.3
10,063.6
24.1
54.7
RECN
Resources Connection, Inc.
14.62
4.6
468.2
15.1
69.4
REG
Regency Centers Corp.
68.08
2.6
11,431.1
39.8
102.5
REIS
Reis, Inc.
0.00
0.0
0.0
RES
RPC, Inc.
4.49
7.1
965.6
-18.7
-132.9
RGA
Reinsurance Group of America, Inc.
160.03
1.6
10,001.0
12.9
20.2
RGR
Sturm, Ruger & Co., Inc.
45.57
2.0
796.1
19.5
39.2
RHI
Robert Half International, Inc.
59.19
2.0
6,958.4
15.2
31.1
RICK
RCI Hospitality Holdings, Inc.
19.30
0.7
185.6
11.6
7.8
RLI
RLI Corp.
96.78
2.0
4,339.2
36.8
72.2
RMAX
RE/MAX Holdings, Inc.
34.86
2.4
621.7
22.6
53.8
RMCF
Rocky Mountain Chocolate Factory, Inc.
9.04
5.3
54.2
20.8
110.5
RMD
ResMed, Inc.
145.45
1.3
20,913.7
49.8
64.7
RNR
RenaissanceRe Holdings Ltd.
182.78
0.7
8,071.9
13.5
10.0
RNST
Renasant Corp.
35.03
2.5
2,012.6
11.8
28.9
ROIC
Retail Opportunity Investments Corp.
18.35
4.2
2,142.2
42.4
177.9
ROK
Rockwell Automation, Inc.
176.74
2.2
20,680.0
20.5
44.9
ROL
Rollins, Inc.
38.00
2.0
12,444.5
61.1
120.7
ROST
Ross Stores, Inc.
109.39
0.9
39,569.6
24.7
22.3
ROYT
Pacific Coast Oil Trust
1.32
19.3
50.9
4.0
78.0
RRC
Range Resources Corp.
4.20
1.9
1,051.0
-0.6
-1.2
RRD
R.R. Donnelley & Sons Co.
4.46
3.3
320.7
-83.4
-276.0
RRR
Red Rock Resorts, Inc.
21.33
3.7
2,515.4
47.5
177.1
RS
Reliance Steel & Aluminum Co.
118.57
2.3
7,873.4
12.8
29.2
RUTH
Ruth's Hospitality Group, Inc.
20.72
2.4
622.8
14.6
35.3
RWT
Redwood Trust, Inc.
16.62
7.2
1,862.9
12.2
87.9
RYAM
Rayonier Advanced Materials, Inc.
4.18
4.9
269.4
-160.8
-792.5
RYN
Rayonier, Inc.
29.19
4.6
3,783.9
54.7
252.9
SABR
Sabre Corp.
22.17
2.5
6,042.8
25.2
63.9
SAFT
Safety Insurance Group, Inc.
99.84
3.3
1,535.9
14.7
48.7
SALM
Salem Media Group, Inc.
1.55
16.8
32.6
-7.9
-132.8
SAMG
Silvercrest Asset Management Group, Inc.
12.20
4.8
164.2
11.9
57.7
SBFG
SB Financial Group, Inc.
16.65
2.7
106.8
10.9
29.0
SBGI
Sinclair Broadcast Group, Inc.
42.15
1.9
3,897.3
12.3
23.2
SBR
Sabine Royalty Trust
38.15
9.5
556.2
11.1
104.9
SBSI
Southside Bancshares, Inc.
35.09
3.5
1,184.3
16.0
56.4
SCHL
Scholastic Corp.
37.93
2.0
1,318.1
75.3
148.8
SCI
Service Corp. International
46.01
1.5
8,355.8
20.2
31.3
SCL
Stepan Co.
98.49
1.3
2,221.6
21.0
27.2
SEB
Seaboard Corp.
4,266.99
0.2
4,966.4
84.2
16.3
SEE
Sealed Air Corp.
42.04
2.3
6,496.3
18.0
41.0
SELF
Global Self Storage, Inc.
4.61
5.6
35.6
72.0
406.3
SEMG
SemGroup Corp.
15.90
11.9
1,251.1
-18.4
-219.1
SF
Stifel Financial Corp.
57.72
1.0
4,016.4
10.0
9.9
SFL
SFL Corp Ltd
14.84
9.4
1,596.9
17.3
163.5
SGA
Saga Communications, Inc.
30.22
4.8
179.7
12.7
61.2
SGB
Southwest Georgia Financial Corp.
20.31
2.4
51.7
10.1
23.9
SHOO
Steven Madden Ltd.
39.60
1.6
3,043.1
23.0
36.0
SHW
The Sherwin-Williams Co.
578.24
0.9
53,376.8
38.1
35.5
SIG
Signet Jewelers Ltd.
17.75
10.4
927.7
-4.2
-44.0
SIGI
Selective Insurance Group, Inc.
71.90
1.1
4,256.8
18.1
20.2
SIX
Six Flags Entertainment Corp.
43.50
7.5
3,676.8
13.6
102.6
SJM
The J. M. Smucker Co.
106.98
6.5
12,200.9
22.7
147.6
SJR
Shaw Communications, Inc.
20.11
7.9
10,393.3
18.7
147.3
SJT
San Juan Basin Royalty Trust
2.58
12.0
120.3
7.0
83.6
SJW
SJW Group
72.60
1.6
2,064.9
39.6
64.3
SLF
Sun Life Financial, Inc.
45.19
4.5
26,715.0
15.2
68.8
SLGN
Silgan Holdings, Inc.
31.07
1.4
3,454.2
17.5
24.2
SMG
Scotts Miracle-Gro Co.
97.45
2.3
5,420.9
14.6
33.4
SMMF
Summit Financial Group, Inc. (West Virginia)
26.26
2.2
325.7
10.5
23.3
SMP
Standard Motor Products, Inc.
51.43
1.8
1,143.1
22.7
39.9
SNA
Snap-On, Inc.
166.33
2.3
9,122.5
13.2
30.2
SNR
New Senior Investment Group, Inc.
7.01
7.4
582.7
-4.5
-33.1
SO
The Southern Co.
61.01
5.0
63,769.5
14.3
71.5
SON
Sonoco Products Co.
58.73
3.6
5,877.5
SPGI
S&P Global, Inc.
248.59
0.9
61,227.7
31.3
27.8
SPKE
Spark Energy, Inc.
9.62
9.4
339.4
-12.7
-119.8
SPOK
Spok Holdings, Inc.
11.71
5.3
220.8
-209.1
-1,116.1
SPTN
SpartanNash Co.
13.80
5.4
501.4
111.6
606.3
SSI
Stage Stores, Inc.
2.41
2.1
69.6
-0.6
-1.3
SSL
Sasol Ltd.
20.28
2.0
12,669.2
10.6
21.3
SSNC
SS&C Technologies Holdings, Inc.
51.46
0.7
13,134.6
40.3
29.6
SSP
The E.W. Scripps Co.
13.99
1.4
1,140.3
34.3
48.7
STAG
STAG Industrial, Inc.
30.92
5.8
4,233.8
STBZ
State Bank Financial Corporation
0.00
0.0
0.0
STC
Stewart Information Services Corp.
39.79
3.0
943.5
STE
STERIS Plc (Ireland)
139.54
1.0
11,810.4
37.0
36.9
STFC
State Auto Financial Corp.
33.90
1.2
1,476.1
28.1
33.2
STI
SunTrust Banks, Inc.
69.57
3.0
30,891.4
12.7
37.5
STM
STMicroelectronics NV
23.26
1.6
20,469.7
18.6
29.2
STNG
Scorpio Tankers, Inc.
32.43
0.9
1,701.0
-10.8
-10.2
STRA
Strategic Education, Inc.
128.09
1.6
2,824.6
-498.2
-774.4
STRT
STRATTEC Security Corp.
21.99
3.2
83.7
-4.2
-13.4
SU
Suncor Energy, Inc.
30.15
6.7
47,322.0
11.1
74.2
SWK
Stanley Black & Decker, Inc.
152.09
2.2
23,078.6
32.7
72.2
SWKS
Skyworks Solutions, Inc.
91.66
1.7
15,738.3
17.4
29.9
SWM
Schweitzer-Mauduit International, Inc.
40.53
4.4
1,249.7
14.5
63.1
SWX
Southwest Gas Holdings, Inc.
86.42
3.1
4,694.7
22.8
70.5
SXT
Sensient Technologies Corp.
62.42
2.9
2,641.6
20.0
58.6
SYMC
Symantec Corp.
22.85
1.3
14,122.0
123.7
162.4
SYX
Systemax, Inc.
24.58
28.4
921.4
24.6
698.9
TACT
TransAct Technologies, Inc.
11.61
3.1
86.7
19.3
59.8
TAP
Molson Coors Brewing Co.
54.57
3.3
11,803.0
13.2
43.5
TCBK
TriCo Bancshares
36.96
2.1
1,127.6
13.2
28.1
TCO
Taubman Centers, Inc.
38.40
7.0
2,350.4
51.9
362.3
TDS
Telephone & Data Systems, Inc.
26.38
2.5
3,020.8
19.4
48.2
TECH
Bio-Techne Corp.
210.49
0.6
7,963.0
82.9
50.7
TECK
Teck Resources Ltd.
16.78
1.8
9,436.7
7.6
13.3
TEL
TE Connectivity Ltd.
94.56
1.9
31,766.0
10.1
19.2
TEN
Tenneco, Inc.
14.87
3.4
1,200.1
-10.6
-35.8
TEO
Telecom Argentina SA
9.15
14.3
1,156.1
10.8
154.5
TER
Teradyne, Inc.
64.33
0.6
10,886.7
23.0
12.9
TERP
TerraForm Power, Inc.
16.46
4.8
3,739.4
-56.1
-270.7
TEX
Terex Corp.
29.13
1.8
2,080.5
561.2
1,037.1
TFSL
TFS Financial Corp.
19.08
5.3
5,342.0
66.0
352.8
TFX
Teleflex, Inc.
327.34
0.4
15,133.9
55.5
23.1
TGI
Triumph Group, Inc.
20.62
0.8
1,032.2
-4.5
-3.5
TGT
Target Corp.
109.72
3.0
56,059.1
18.0
53.2
THG
The Hanover Insurance Group, Inc.
126.14
5.7
4,989.3
17.1
97.2
TIER
TIER REIT, Inc.
28.88
1.2
1,603.4
-56.4
-70.3
TILE
Interface, Inc.
16.90
1.9
985.8
14.4
27.8
TIVO
TiVo Corp.
7.95
6.4
1,018.8
-2.8
-18.2
TJX
The TJX Cos., Inc.
58.34
1.9
70,747.2
23.2
42.9
TKR
The Timken Co.
48.04
2.3
3,660.7
11.6
27.0
TLRD
Tailored Brands, Inc.
5.08
14.2
257.3
4.2
58.9
TNC
Tennant Co.
70.32
1.3
1,280.2
33.8
42.2
TNK
Teekay Tankers Ltd.
2.13
0.0
586.4
-73.2
0.0
TPL
Texas Pacific Land Trust
608.30
1.0
4,746.0
15.6
15.3
TR
Tootsie Roll Industries, Inc.
33.58
1.1
2,200.7
35.2
37.8
TRCO
Tribune Media Co.
46.66
2.1
4,125.2
11.3
24.2
TRI
Thomson Reuters Corp.
66.75
4.3
33,236.7
68.8
298.1
TRK
Speedway Motorsports LLC
19.78
3.0
808.1
21.5
65.2
TRMK
Trustmark Corp.
34.74
3.3
2,232.5
14.8
49.0
TROW
T. Rowe Price Group, Inc.
117.08
2.5
27,358.9
14.7
37.3
TROX
Tronox Holdings Plc
8.65
2.1
1,227.3
-12.8
-26.6
TRTN
Triton International Ltd.
36.92
7.0
2,667.0
8.4
59.5
TRV
The Travelers Cos., Inc.
129.30
3.1
33,374.0
14.4
44.6
TSCO
Tractor Supply Co.
95.71
1.4
11,414.9
20.8
28.7
TSLX
TPG Specialty Lending, Inc.
21.23
8.4
1,406.9
10.1
84.5
TSN
Tyson Foods, Inc.
82.08
2.3
24,187.0
13.4
30.5
TTEK
Tetra Tech, Inc.
88.27
0.6
4,837.5
27.7
16.9
TXRH
Texas Roadhouse, Inc.
57.38
2.3
3,490.5
25.2
57.7
UBCP
United Bancorp, Inc. (Ohio)
11.83
4.9
70.0
12.1
59.7
UBOH
United Bancshares, Inc. (Ohio)
20.51
3.1
67.1
7.5
23.4
UCBA
United Community Bancorp
0.00
0.0
0.0
UE
Urban Edge Properties
21.15
4.2
2,564.0
29.8
123.9
UFAB
Unique Fabricating, Inc.
2.60
7.7
25.4
-3.4
-26.5
UFCS
United Fire Group, Inc.
45.50
2.8
1,149.2
51.9
146.0
UGP
Ultrapar Participaçoes SA
4.78
4.8
5,245.5
16.9
80.6
UHS
Universal Health Services, Inc.
138.08
0.4
12,218.6
17.1
6.2
UIHC
United Insurance Holdings Corp.
12.13
2.0
524.4
-31.9
-63.2
UL
Unilever Plc
58.99
3.8
68,478.8
14.6
56.1
ULH
Universal Logistics Holdings, Inc.
18.55
4.0
506.1
13.9
55.5
UMH
UMH Properties, Inc.
14.68
7.4
593.5
-12.6
-92.8
UN
Unilever NV
58.19
3.9
84,426.8
14.4
56.0
UNF
UniFirst Corp.
205.18
0.2
3,912.2
21.0
4.6
UNH
UnitedHealth Group, Inc.
247.05
1.6
234,124.6
UNP
Union Pacific Corp.
170.75
2.1
118,534.7
20.0
41.4
UNTY
Unity Bancorp, Inc.
21.19
1.4
230.3
9.8
13.9
UPS
United Parcel Service, Inc.
116.25
3.3
99,742.5
20.1
65.6
USLM
United States Lime & Minerals, Inc.
84.60
0.6
474.8
23.8
15.2
UTX
United Technologies Corp.
143.04
2.6
123,457.5
23.9
61.5
UVE
Universal Insurance Holdings, Inc.
29.06
2.6
992.7
9.3
24.6
V
Visa, Inc.
179.84
0.7
312,633.8
34.5
24.9
VAC
Marriott Vacations Worldwide Corp.
110.07
1.6
4,791.0
135.7
222.0
VALE
Vale SA
12.14
0.0
62,719.0
18.0
0.0
VALU
Value Line, Inc.
23.28
3.4
224.9
19.2
65.1
VEDL
Vedanta Ltd.
8.37
12.8
7,778.2
8.0
101.7
VET
Vermilion Energy, Inc.
15.43
19.4
2,394.1
8.9
172.6
VFC
VF Corp.
83.45
4.6
33,227.9
25.7
119.3
VGR
Vector Group Ltd.
12.23
13.1
1,807.5
22.9
299.3
VHI
Valhi, Inc.
1.89
4.3
637.8
3.4
14.4
VIRT
Virtu Financial, Inc.
17.18
5.6
3,274.7
35.1
196.3
VLO
Valero Energy Corp.
100.07
3.5
41,469.3
18.0
63.1
VMC
Vulcan Materials Co.
145.71
1.0
19,275.5
34.2
35.7
VOYA
Voya Financial, Inc.
55.15
0.3
7,722.6
13.0
4.3
VSH
Vishay Intertechnology, Inc.
19.75
1.9
2,721.4
9.5
18.2
VVC
Vectren Corporation
0.00
0.0
0.0
VVV
Valvoline, Inc.
21.47
2.0
4,049.8
18.0
35.4
WBA
Walgreens Boots Alliance, Inc.
55.80
4.0
50,395.4
12.9
51.8
WCN
Waste Connections, Inc.
91.93
0.7
23,716.8
43.5
31.0
WEBK
Wellesley Bancorp, Inc.
32.00
0.7
81.9
12.2
8.8
WEC
WEC Energy Group, Inc.
92.53
3.1
29,187.3
26.7
83.9
WEN
The Wendy's Co.
21.00
2.4
4,820.2
10.5
25.3
WEYS
Weyco Group, Inc.
24.79
3.8
247.4
11.7
44.4
WFC
Wells Fargo & Co.
51.65
4.5
220,499.0
11.1
50.4
WHR
Whirlpool Corp.
154.54
3.8
9,766.9
9.3
35.4
WINA
Winmark Corp.
182.80
0.6
700.3
22.4
12.9
WLK
Westlake Chemical Corp.
65.31
1.6
8,377.2
13.6
21.1
WM
Waste Management, Inc.
111.28
1.8
47,209.5
26.9
48.4
WMB
The Williams Cos., Inc.
22.97
6.4
27,840.1
302.6
1,949.9
WMS
Advanced Drainage Systems, Inc.
36.79
3.6
2,508.9
-11.0
-40.1
WOR
Worthington Industries, Inc.
37.61
3.1
2,103.3
22.8
70.8
WPG
Washington Prime Group, Inc.
4.36
22.9
813.6
28.5
653.2
WRE
Washington Real Estate Investment Trust
30.06
5.0
2,415.3
7.2
35.7
WRI
Weingarten Realty Investors
29.60
10.1
3,808.6
17.3
174.2
WSR
Whitestone REIT
14.08
9.4
566.5
30.9
292.1
WSTG
Wayside Technology Group, Inc.
14.31
4.8
64.5
10.1
48.1
WTM
White Mountains Insurance Group Ltd.
1,055.38
0.1
3,371.1
14.7
1.4
WTR
Aqua America, Inc.
44.90
2.0
9,688.4
58.7
116.6
WTS
Watts Water Technologies, Inc.
93.12
0.9
3,172.9
24.9
23.4
WU
The Western Union Co.
25.02
3.2
10,605.8
9.0
28.5
WWD
Woodward, Inc.
107.68
0.7
6,670.1
24.9
18.3
WWE
World Wrestling Entertainment, Inc.
68.57
0.9
5,420.5
69.7
60.7
WY
Weyerhaeuser Co.
29.37
4.6
21,878.6
-145.0
-671.3
WYND
Wyndham Destinations, Inc.
46.35
3.8
4,269.8
10.2
38.9
X
United States Steel Corp.
12.29
1.6
2,101.8
2.2
3.5
XEC
Cimarex Energy Co.
44.57
2.2
4,521.9
7.2
15.5
XIN
Xinyuan Real Estate Co. Ltd.
4.01
10.0
240.2
2.0
20.0
XOM
Exxon Mobil Corp.
68.64
4.9
290,423.4
16.5
81.4
XYL
Xylem, Inc.
84.03
1.4
15,127.8
26.4
36.7
Y
Alleghany Corp.
749.12
0.0
10,753.7
34.6
0.0
YUM
Yum! Brands, Inc.
109.51
1.5
33,322.4
25.5
37.8
ZEUS
Olympic Steel, Inc.
15.17
0.5
167.8
12.0
6.2
ZTS
Zoetis, Inc.
125.13
0.6
59,756.8
43.7
27.3
Ticker Name Price Dividend Yield Market Cap ($M) P/E Ratio Payout Ratio
Keep reading this article to learn more about how to use the list of stocks that pay dividends in March to find investment ideas.
How To Use The March Dividend Stocks List To Find Investment Ideas
Having an Excel database that contains every stock that pays dividends in March is very useful for the income-oriented investor.
This document becomes even more useful when combined with a working knowledge of Microsoft Excel.
With that in mind, this tutorial will show you how to implement two additional investing screens to the stocks in the March dividend stocks database.
The first screen that we’ll implement is for stocks that trade with low price-to-earnings multiples and above-average dividend yields.
Screen 1: Price-to-Earnings Below 15, Dividends Yields Above 3%
Step 1: Download your free list of stocks that pay dividends in March by clicking here. Apply Excel’s filter function to every column in the spreadsheet.
Step 2: Click the filter icon at the top of the price-to-earnings ratio column, as shown below.
Step 3: Change the filter setting to “Less Than” and input 15 into the field beside it, as shown below.
Step 4: Close out of the filter window (by clicking the exit button, not by clicking the “Clear Filter” button in the bottom right corner). Then, click on the filter button at the top of the dividend yield column, as shown below.
Step 5: Change the filter setting to “Greater Than” and input 0.03 into the field beside it, as shown below. Note that since dividend yield is measured in percentage points, filtering for stocks with a dividend yield above “0.03” is equivalent to filtering for stocks with dividend yields above 3%.
The remaining stocks in this spreadsheet are stocks that pay dividends in March that have price-to-earnings ratios below 15 and dividend yields above 3%.
The next screen that we’ll demonstrate how to implement is for small- and mid-cap value stocks. More specifically, the filter will look for stocks that pay dividends in March with price-to-earnings ratios below 12 and market capitalizations below $10 billion.
Screen 2: Price-to-Earnings Ratios Below 12, Market Capitalizations Below $10 Billion
Step 1: Download your free list of stocks that pay dividends in March by clicking here. Apply Excel’s filter function to every column in the spreadsheet.
Step 2: Click the filter icon at the top of the price-to-earnings ratio column, as shown below.
Step 3: Change the filter setting to “Less Than” and input 12 into the field beside it, as shown below. This will filter for stocks that pay dividends in March with price-to-earnings ratios less than 12.
Step 4: Close out of the filter window (by clicking the exit button, not by clicking the “Clear Filter” button in the bottom right corner). Next, click the filter icon at the top of the market capitalization column, as shown below.
Step 5: Change the filter setting to “Less Than” and input 10000 into the field beside it, as shown below. Since market capitalization is measured in millions of dollars in this spreadsheet, filtering for stocks with market capitalizations below “$10,000 million” is equivalent to screening for securities with aggregate capitalizations below $10 billion.
You now have a solid, fundamental understanding of how to use the March dividend stocks list to find investment ideas.
The remainder of this article will introduce other investing resources that have the ability to improve your long-term investing outcomes.
Final Thoughts: Other Useful Investing Resources
Having an Excel document that contains the name, tickers, and financial information for all stocks that pay dividends in March is quite useful – but it becomes far more useful when combined with other databases for the non-March months of the calendar year.
Fortunately, Sure Dividend also maintains similar databases for the other 11 months of the year. You can access these databases below:
The Complete List of Stocks That Pay Dividends in January
The Complete List of Stocks That Pay Dividends in February
The Complete List of Stocks That Pay Dividends in April
The Complete List of Stocks That Pay Dividends in May
The Complete List of Stocks That Pay Dividends in June
The Complete List of Stocks That Pay Dividends in July
The Complete List of Stocks That Pay Dividends in August
The Complete List of Stocks That Pay Dividends in September
The Complete List of Stocks That Pay Dividends in October
The Complete List of Stocks That Pay Dividends in November
The Complete List of Stocks That Pay Dividends in December
Having a database of every stock that pays dividends in March allows you to diversify your dividend income based on which month it is paid.
However, this is not all the diversification that an investor really needs. They should also be diversified by sector.
With this in mind, Sure Dividend maintains sector-specific stock market databases which you can download (for free) at the links below:
The Complete List of Dividend-Paying Industrial Stocks
The Complete List of Dividend-Paying Telecommunications Stocks
The Complete List of Dividend-Paying Materials Stocks
The Complete List of Dividend-Paying Utility Stocks
The Complete List of Dividend-Paying Consumer Staples Stocks
The Complete List of Dividend-Paying Consumer Cyclical Stocks
The Complete List of Dividend-Paying Technology Stocks
The Complete List of Dividend-Paying Healthcare Stocks
The Complete List of Dividend-Paying Energy Stocks
The Complete List of Dividend-Paying Financial Stocks
Another form of diversification is by size. Investors should own a healthy balance of small-capitalization stocks, mid-capitalization stocks, and large capitalization stocks.
These universes of stocks are stratified into different stock market indices which are maintained by financial giants like Moody’s, Dow Jones, and Standard & Poor’s. A few large-capitalization indices are shown below:
The Complete List of S&P 500 Stocks
The Complete List of Dow Jones Industrial Average Stocks
The Complete List of NASDAQ-100 Stocks
Alternatively, a few mid- and small-cap indices are listed below:
The Complete List of Wilshire 5000 Stocks
The Complete List of Russell 2000 Stocks
Diversification aside, there is a substantial body of evidence that proves that stocks that consistently raise their dividends over time tend to outperform the broader stock market. With this in mind, the following databases contain some of the most promising businesses in our investing universes:
The Dividend Aristocrats: S&P 500 stocks with 25+ years of consecutive dividend increases
The Dividend Achievers: dividend stocks with 10+ years of consecutive dividend increases
The Dividend Kings: considered to be the best-of-the-best among dividend growth stocks, the Dividend Kings is comprised of dividend stocks with 50+ years of consecutive dividend increases.
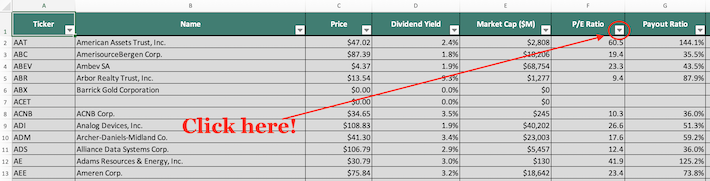
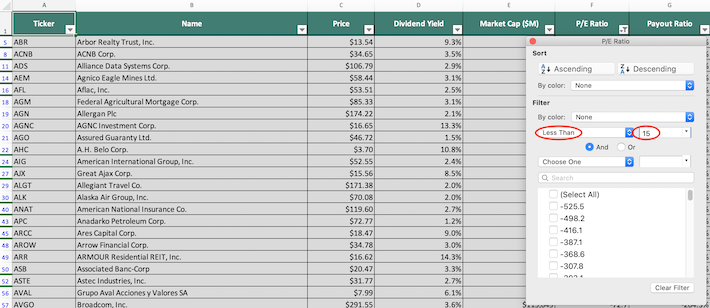
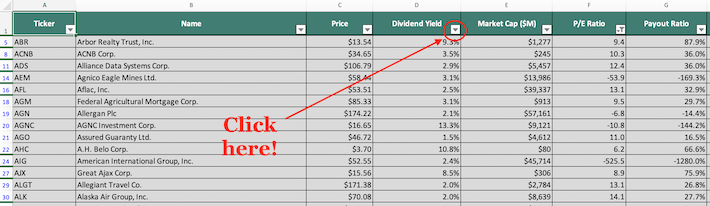
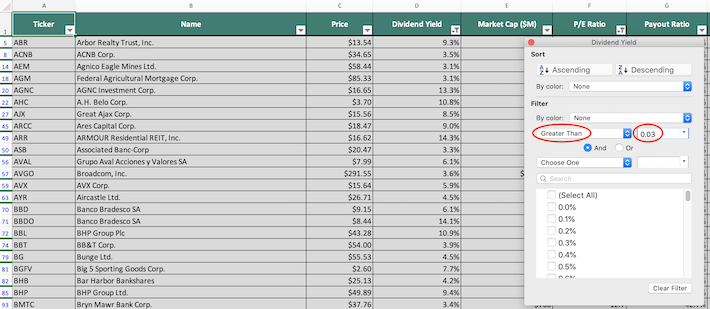
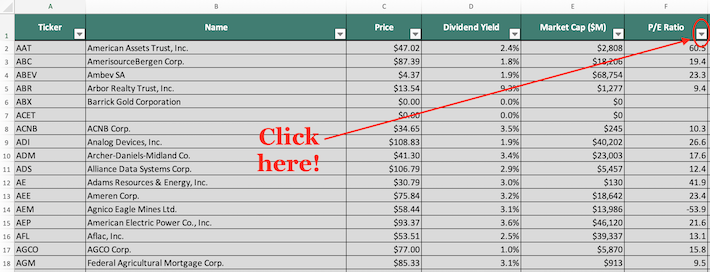
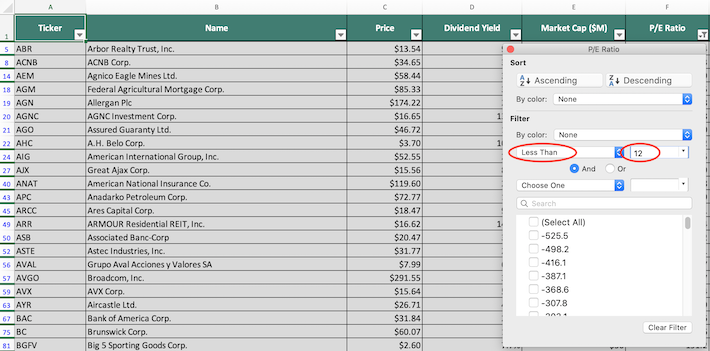
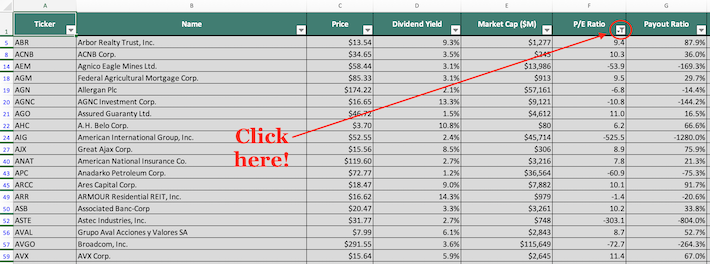
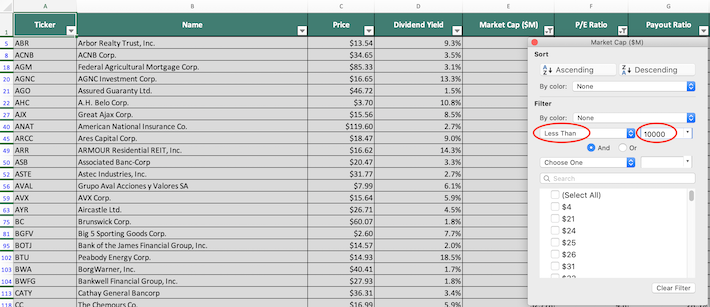