

How does sharewise work?
Discuss
Discuss and share predictions for your favorite stocks in the forum. Let your opinion be heard
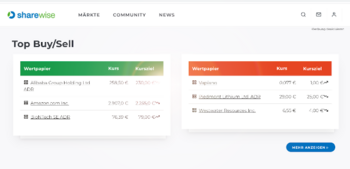
Show moreTop Buy/Sell (This Month)
| Security | Price | Target price |
|---|---|---|
| Rheinmetall AG | €1,755.0 | €2,000.0 |
| DroneShield Ltd | €2.25 | €2.92 |
| Microsoft Corp. | €348.60 | €502.15 |
| Security | Price | Target price |
|---|---|---|
| Dollar Tree Inc. | €99.90 | €106.33 |
| T.Rowe Price Group Inc. | €88.58 | €81.62 |
| HP Inc. | €15.92 | €24.76 |
New Top predictions since last week
| Prediction | User | Perf. (%) |
|---|---|---|
| B Galiano Gold Inc. | Vassago1 | 33.15% |
| B Fintechwerx Intl Software Svcs | LionBeta45 | 29.58% |
| B Marinemax | B. Riley | 23.72% |
| Prediction | User | Perf. (%) |
|---|---|---|
| S Murano Global Investments Ltd. | quelbe60 | -70.86% |
| S Murano Global Investments Ltd. | tbackenh | -59.35% |
| S United Microelectronics ADR | BNP Paribas Exane | -16.49% |
Many tell you which stocks to buy.
We measure how often they are right!


Portfolios of our members
1\3DerAlmanach100000
When it comes to stocks, what is important for you?
Find stocks based on your criteria with our sharewise stock finder. All results are based on thousands of votes by our community
Pros and Cons of these stocks (New Predictions)
Tmp Group S.p.a
WKN: A3D6Q8 / Name: Tmp Group S.p.a / Stock / ? /
Pros
Cons
Battalion Oil Corp.
WKN: A2PZMK / Name: Battalion Oil Corp. / Stock / ? /
Pros
Cons
Try sharewise+ and get hundreds more matching stocks
Sign up for free!Tops & Flops S&P 500
| Security | Price | Change(%) (%) |
|---|---|---|
| Davita Inc. | €114.35 | 21.260% |
| Teradyne Inc. | €235.85 | 11.380% |
| AES Corporation | €13.63 | 9.090% |
| Lyondellbasell Ind. A | €46.10 | 8.170% |
| Whirlpool Corp. | €72.98 | 7.640% |
| Security | Price | Change(%) (%) |
|---|---|---|
| Gartner Inc. | €131.00 | -23.660% |
| Paypal Holdings Inc | €35.84 | -19.440% |
| Equifax Inc. | €148.00 | -12.430% |
| Capri Holdings Ltd. | €17.22 | -12.120% |
| Intuit Inc. | €365.05 | -11.670% |
Courses
sharewise Introduction

Get started on the stock market in these easy steps
Things you will learn:
- What is a stock
- What is a fund
- What is an ETF
- How to open a depot
- How to manage a depot that will regularly beat managed funds
- Why you mostly need patience to succeed on the stock market
Predictions
Estee Lauder Companies A
17:00
03.02.27
18:32
Top News

Revisiting Hertz’s Amazon Partnership 5 Months Later: The Good, the Bad, the Risk
It has been a rough ride for shareholders of Hertz Global Holdings (NASDAQ: HTZ). Over the past five years, shares are down more than 79%, including a nearly 43% loss since the stock’s one-year

Snowflake’s $200M Bet: Can The OpenAI Deal Fix the Slump?
On the first trading day of February, Snowflake Inc. (NYSE: SNOW) announced a strategic move that many investors have been waiting for. The data cloud company signed a multi-year, $200 million

From Holding to Hedging: The "Crypto Casino" Trade Is Taking Over
In the fast-paced financial markets, a crash is often easier to handle than a flatline. Volatility offers opportunity; stagnation breeds apathy. As of early February 2026, the cryptocurrency

Unity’s 25% Drop: Gaming Crisis or Buying Opportunity?
The stock market hates uncertainty, and nothing creates uncertainty quite like a technological breakthrough that threatens to erase an entire industry. For shareholders of Unity Software (NYSE: U)
Why Tyson Foods Looks Like a Tasty Treat for Income Investors Right Now
Tyson Foods (NYSE: TSN) stock is breaking out of its trading range, signalling bigger gains ahead for investors. The breakout is underpinned by improvements in operational quality and global
Graco Inc. (GGG)'s Technical Outlook is Bright After Key Golden Cross
From a technical perspective, Graco Inc. (GGG) is looking like an interesting pick, as it just reached a key level of support. GGG's 50-day simple moving average crossed above its 200-day simple


Wall Street Analysts See a 319.23% Upside in Janux Therapeutics (JANX): Can the Stock Really Move This High?
Shares of Janux Therapeutics, Inc. (JANX) have gained 1.8% over the past four weeks to close the last trading session at $13.99, but there could still be a solid upside left in the stock if

Wall Street Analysts Predict a 65.75% Upside in Aldeyra Therapeutics (ALDX): Here's What You Should Know
Aldeyra Therapeutics, Inc. (ALDX) closed the last trading session at $5.43, gaining 28.1% over the past four weeks, but there could be plenty of upside left in the stock if short-term price targets
4 Miscellaneous Food Stocks Poised for Growth in a Difficult Market
Here's Why Revvity (RVTY) is a Strong Momentum Stock
It doesn't matter your age or experience: taking full advantage of the stock market and investing with confidence are common goals for all investors. Luckily, Zacks Premium offers several different
Why Viav Solutions (VIAV) is a Top Momentum Stock for the Long-Term
Taking full advantage of the stock market and investing with confidence are common goals for new and old investors, and Zacks Premium offers many different ways to do both.
The popular research
News

Why Wheaton Precious Metals Corp. (WPM) is a Top Momentum Stock for the Long-Term
For new and old investors, taking full advantage of the stock market and investing with confidence are common goals. Zacks Premium provides lots of different ways to do both.
The popular research

Why ManpowerGroup (MAN) is a Top Momentum Stock for the Long-Term
It doesn't matter your age or experience: taking full advantage of the stock market and investing with confidence are common goals for all investors. Luckily, Zacks Premium offers several different
Here's Why Kroger (KR) is a Strong Momentum Stock
For new and old investors, taking full advantage of the stock market and investing with confidence are common goals. Zacks Premium provides lots of different ways to do both.
Featuring daily updates

Why Epam (EPAM) is a Top Momentum Stock for the Long-Term
Taking full advantage of the stock market and investing with confidence are common goals for new and old investors, and Zacks Premium offers many different ways to do both.
The popular research
Here's Why Exelixis (EXEL) is a Strong Momentum Stock
Taking full advantage of the stock market and investing with confidence are common goals for new and old investors, and Zacks Premium offers many different ways to do both.
The popular research
Why HCA Healthcare (HCA) is a Top Momentum Stock for the Long-Term
It doesn't matter your age or experience: taking full advantage of the stock market and investing with confidence are common goals for all investors. Luckily, Zacks Premium offers several different
Infineon Technologies AG (IFNNY) is a Top-Ranked Momentum Stock: Should You Buy?
For new and old investors, taking full advantage of the stock market and investing with confidence are common goals. Zacks Premium provides lots of different ways to do both.
Featuring daily updates
Here's Why Apple (AAPL) is a Strong Momentum Stock
Taking full advantage of the stock market and investing with confidence are common goals for new and old investors, and Zacks Premium offers many different ways to do both.
The popular research
Why Dover Corporation (DOV) is a Top Momentum Stock for the Long-Term
Taking full advantage of the stock market and investing with confidence are common goals for new and old investors, and Zacks Premium offers many different ways to do both.
The research service
Contest

Still running

Heibel Ticker
sharewise sagt: Stephan Heibel ist ein langähriger Unterstützer und Autor der Wunschanalyse. Er betreibt meiner Meinung nach einen der besten Börsenbriefe. Es gibt eine kostenlose und eine Premium Variante.
Kostenlos ausprobierensharewise
Du findest das sharewise Projekt spannend und möchtest es unterstützen?
Mit einer
sharewise+-Mitgliedschaft
unterstützt du uns finanziell und bekommst zusätzliche Funktionalitäten freigeschalten.

Leeway
Die Analyse-Plattform Leeway untersucht mit KI-unterstützten Algorithmen aussagekräftige Zusammenhänge am Aktienmarkt. Anhand von vielen Millionen Datenpunkten finden die Algorithmen die Kennzahlen und Bewegungen, die nachweisbare Auswirkungen haben und Vorteile schaffen.
Kostenlos ausprobierensharewise
Du findest das sharewise Projekt spannend und möchtest es unterstützen?
Mit einer
sharewise+-Mitgliedschaft
unterstützt du uns finanziell und bekommst zusätzliche Funktionalitäten freigeschalten.