

How does sharewise work?
Discuss
Discuss and share predictions for your favorite stocks in the forum. Let your opinion be heard
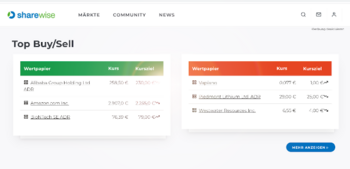
Show moreTop Buy/Sell (This Month)
| Security | Price | Target price |
|---|---|---|
| NVIDIA Corp. | €178.04 | €216.93 |
| Palo Alto Networks | €236.10 | €270.96 |
| Zscaler Inc | €113.48 | €263.81 |
| Security | Price | Target price |
|---|---|---|
| HP Inc. | €22.19 | €16.33 |
| Sivers Ima Holding Ab | ? | - |
| General Mills Inc. | €28.75 | €40.00 |
New Top predictions since last week
| Prediction | User | Perf. (%) |
|---|---|---|
| B Astrotech Corp. | Wolf_of_WS | 57.03% |
| B Robostrategy Inc | AlexanderDanielSchneider | 49.53% |
| B Victoria S Secret & Co. | DerAlmanach100000 | 33.86% |
| Prediction | User | Perf. (%) |
|---|---|---|
| S Virgin Galactic Holdings Inc. | Bankster | -44.38% |
| S Virgin Galactic Holdings Inc. | Traumtanz | -40.17% |
| S Digital Brands Group Inc. | Wolf_of_WS | -33.17% |
Many tell you which stocks to buy.
We measure how often they are right!


Portfolios of our members
A.D.S.....8

When it comes to stocks, what is important for you?
Find stocks based on your criteria with our sharewise stock finder. All results are based on thousands of votes by our community
Pros and Cons of these stocks (New Predictions)
Nike Inc. B
WKN: 866993 / Symbol: NKE / Name: Nike / Stock / Textiles & Apparel / Large Cap /
Pros
Cons
adidas AG
WKN: A1EWWW / Symbol: ADDDF / Name: adidas / Stock / Textiles & Apparel / Large Cap /
Pros
Cons
Try sharewise+ and get hundreds more matching stocks
Sign up for free!Tops & Flops S&P 500
| Security | Price | Change(%) (%) |
|---|---|---|
| Coty Inc | €1.71 | 6.250% |
| Kimberly-Clark Corp | €85.95 | 5.690% |
| Clorox Co. | €81.68 | 5.570% |
| Progressive Corp. | €177.20 | 5.470% |
| Everest Reinsurance | €290.20 | 5.380% |
| Security | Price | Change(%) (%) |
|---|---|---|
| Micron Technology Inc. | €755.00 | -12.160% |
| Ipg Photonics | €93.10 | -11.640% |
| Teradyne Inc. | €310.70 | -11.530% |
| Intel Corp. | €85.89 | -10.900% |
| Qualcomm Inc. | €187.04 | -10.490% |
Courses
Get started on the stock market in these easy steps
Things you will learn:
- What is a stock
- What is a fund
- What is an ETF
- How to open a depot
- How to manage a depot that will regularly beat managed funds
- Why you mostly need patience to succeed on the stock market

sharewise Introduction
Predictions
Canadian Pacific City Kansas Ltd.
22:15
05.06.27
08:04
Nike Inc. B
22:00
05.06.29
21:58

Top News

Assembly Biosciences Eyes Gilead HSV Plan as ABI-6250 Liver Pipeline Expands
Key Points
- Interested in Assembly Biosciences, Inc.? Here are five stocks we like better.
- Assembly Biosciences is waiting on Gilead’s development plan for its HSV assets ABI-5366 and ABI-1179
Arrowhead Pharmaceuticals Lines Up SHASTA Readout as REDEMPLO Launch Gains Traction
Key Points
- Interested in Arrowhead Pharmaceuticals, Inc.? Here are five stocks we like better.
- SHASTA-3 and SHASTA-4 topline data for plozasiran in severe hypertriglyceridemia remain on track

Arvinas Sharpens Pipeline Focus After First PROTAC Approval, Eyes Key Trial Data
Key Points
- Interested in Arvinas, Inc.? Here are five stocks we like better.
- Arvinas is narrowing its pipeline focus after the first PROTAC approval, concentrating internal investment on

Quanex Building Products Q2 Earnings Call Highlights
Key Points
- Interested in Quanex Building Products Corporation? Here are five stocks we like better.
- Quanex’s second-quarter revenue rose 2.2% to $462.4 million, but earnings fell sharply as

Navitas: NVIDIA’s AI Power Broker?
Key Points
- Interested in Navitas Semiconductor Corporation? Here are five stocks we like better.
- Navitas Semiconductor's integration into NVIDIA's MGX ecosystem, featuring 97.5% efficiency and

Casino Bonuses Through a Financial Lens: Value, Risk, and Consumer Strategy


Why TSMC Is a Better AI Stock to Hold Right Now Than Broadcom
AI spending remains concentrated around advanced computing infrastructure, benefiting companies involved in chip design, manufacturing, packaging and memory. Yet, recent market actions suggest that

3 Top Breakout Stocks to Buy in June for Strong Upside Potential
With June now underway, investors may benefit from a proactive stock selection approach by identifying stocks trading within well-defined price ranges and showing breakout opportunities. In this
Affirm's Expanded CPP Investments Deal Supports $8B in Loan Volume
Affirm Holdings, Inc. AFRM has renewed and expanded its funding partnership with Canada Pension Plan Investment Board (CPP Investments). Under the new 24-month forward-flow agreement, CPP

Cencora's Specialty Supply Chain: Where COR's Growth Is Headed
Cencora COR is trying to do more than move pharmaceuticals from point A to point B. The company is leaning into higher-value services that help manufacturers reach community sites of care, while
News

Here's Why You Should Retain Glaukos Stock in Your Portfolio Now
Glaukos Corporation’s GKOS growth prospects are supported by the continued expansion of interventional glaucoma, growing clinical and commercial synergies between iDose TR and iStent infinite, and
Celanese Streamlines Engineered Materials Network Across Asia
Celanese Corporation CE is shifting production from its Engineered Materials compounding facility in Ulsan, South Korea, to its plants in Nanjing and Shenzhen, China, and Silvassa, India. The move
ICLR Earnings Reset: What the Accounting Probe Changed
ICON plc ICLR is moving through a credibility and earnings reset that is now as much about controls as it is about demand. The company has laid out the scope of its accounting findings, flagged


Block's Cash App Unveils NFC-Powered Tags for Faster Payments
Block’s XYZ Cash App, the popular peer-to-peer payment platform, is introducing a new way to pay with the launch of Cash App Tags. These NFC-enabled physical payment accessories allow customers to
Here's Why Investors Should Hold on to Teladoc Health Stock for Now
Teladoc Health, Inc. TDOC is a pioneer and global leader in the telemedicine industry. It has a broad international presence, serving clients, supporting medical operations and reaching members
AGEN Early Access Revenues Signal a New Path Ahead of Approval
Agenus AGEN is taking an uncommon route to validate demand for its lead immuno-oncology combination, botensilimab plus balstilimab (BOT+BAL), before a traditional launch. Instead of waiting for full
Is Agenus Stock a Hold Amid Valuation and Funding Risks?
Agenus AGEN sits at a classic biotech crossroads. On one side is BOT+BAL, a lead immuno-oncology program being tested in a late-stage setting where current checkpoint inhibitors have historically
AGEN BOT+BAL: What the BATTMAN Trial Means for mCRC
Agenus AGEN centered its investment case on botensilimab plus balstilimab (BOT+BAL), a checkpoint combination being advanced in refractory microsatellite stable (MSS)/mismatch repair proficient
Contest

Still running

Heibel Ticker
sharewise sagt: Stephan Heibel ist ein langähriger Unterstützer und Autor der Wunschanalyse. Er betreibt meiner Meinung nach einen der besten Börsenbriefe. Es gibt eine kostenlose und eine Premium Variante.
Kostenlos ausprobieren
Leeway
Die Analyse-Plattform Leeway untersucht mit KI-unterstützten Algorithmen aussagekräftige Zusammenhänge am Aktienmarkt. Anhand von vielen Millionen Datenpunkten finden die Algorithmen die Kennzahlen und Bewegungen, die nachweisbare Auswirkungen haben und Vorteile schaffen.
Kostenlos ausprobierensharewise
Du findest das sharewise Projekt spannend und möchtest es unterstützen?
Mit einer
sharewise+-Mitgliedschaft
unterstützt du uns finanziell und bekommst zusätzliche Funktionalitäten freigeschalten.
sharewise
Du findest das sharewise Projekt spannend und möchtest es unterstützen?
Mit einer
sharewise+-Mitgliedschaft
unterstützt du uns finanziell und bekommst zusätzliche Funktionalitäten freigeschalten.