

A ‘Sure-Thing’?


The following financial news was released on September 7/18, at 8:30 a.m.:
Non farm payrolls in the United States increased by 201 thousand in August of 2018, following a downwardly revised 147 thousand in July and above market expectations of 191 thousand. Employment increased in professional and business services, health care, wholesale trade, transportation and warehousing, and mining.

Nonfarm Payrolls Private in the United States increased by 204 thousand in August of 2018. Nonfarm Payrolls Private in the United States averaged 108.46 Thousand from 1950 until 2018, reaching an all time high of 1089 Thousand in September of 1983 and a record low of -821 Thousand in April of 2009.

US average hourly earnings for all employees on private nonfarm payrolls rose by 10 cents to USD 27.16, or 0.4 percent, in August 2018, following an unrevised 0.3 percent gain in July and above expectations of a 0.2 percent gain.

Now imagine that the day before, September 6/18, at 3:00 p.m., you received the above positive information from an anonymous source. You neither stole this information yourself, nor did you conspire with anyone else to steal it. Even though you have no way of knowing the veracity of the information, most market participants would understand if you jumped on your keyboard and bought some SPXL call options before the close. Having “tomorrow’s news, today” is obviously a ‘sure-thing’. Or is it?
The SPX opened down, closed down, and and spent less than 2 hours during the day trading slightly in the green. Had you bet on this ‘sure-thing’, you would have likely lost money.
This scenario illustrates our hypothesis that financial or geopolitical news does not produce a consistent nor durable reaction in the stock market, and, therefore, cannot be depended on to derive probabilities of future market moves. Good news cannot be trusted to push the market higher, just like bad news often does not push the market lower. The only constant factor through time is the dual emotion of fear; fear of losing, and fear of missing-out (greed). While every market has differences, they all have similar ‘rhymes’. And these rhymes are a result of the underlying fears of the participants.
Let’s look at the rhymes.
Equities
Sentiment
{This section is for full members only. Consider joining us at www.angtraders.com}
The bull-minus-bear differential stands at +16% which is a level that carries only a 1/4 chance of forming a top. The recent small correction in the S&P 500 is unlikely to be serious (chart below).

The CNN Fear & Greed index is neutral, which also implies a low probability of any serious correction see below).

{This section is for full members only. Consider joining us at www.angtraders.com}
The put-to-call ratio has a strong negative-correlation with the SPX; down-spikes in the 8-week MA indicate local market tops, while up-spikes indicate local bottoms.
Between late June and mid-August, the 8-week MA was rising, which normally correlates with a decreasing SPX, but this time, the SPX was rallying along with the Put-to-call ratio. This unusual positive-correlation is a strong bullish signal; if the market can rally even during a bearish put-to-call pattern, then when the put-to-call pattern actually turns bullish we expect the market to keep rallying even stronger.
For more than two weeks, the 8-week MA had been dropping after making an up-spike and the SPX had rallied as expected. During the last couple of days, the put-to-call ratio has been rising and the SPX has fallen. This pattern is neutral at this point; we could see more follow-through to the downside, but the long-term bullish picture has not changed (chart below).

The price/earnings ratio of the S&P 500, in ratio to the volatility index (PE:VIX), has a strong direct-correlation to the S&P 500; 85% of up-spikes in the ratio correspond with local market tops, while nearly 100% of down-spikes correspond with market lows.
Last week, we wrote:
The ratio looks to be forming a down spike, which implies further upside for the market.
{This section is for full members only. Consider joining us at www.angtraders.com}
The volatility index (VIX), by itself, has a strong inverse correlation with the S&P 500; down-spikes in the VIX correlate with market highs. As we have been stating for several weeks now, the current VIX pattern has some potential to move up (SPX down) without changing the over-all bullish pattern.
This week the VIX did move up slightly and the SPX retreated back to the old high of 2872. We could see some more follow-through without affecting the over-all bullish bias of the market. The VIX now has even more room to drop (and the SPX rise) than it did a couple of days ago (chart below).

{This section is for full members only. Consider joining us at www.angtraders.com}
Technical
At this point, the long-term technical picture continues strong without any warning flags:
- The 8-month MA remains above the 12-month MA.
- The RSI has dropped slightly this past week, but is not of concern .
- The S&P 500 continues above the 8-month MA.
- The MACD continues to diverge away from a bear cross-over.
- The ADX +DI has started to turn back up, and the -DI has started to turn back down.
- The stochastic continues to move higher .
This pattern is similar to what happened during the 1998–2000 trading period (shaded areas on the chart below). The only worry we have is that the ADX trend strength (black curve) has reached the down-sloping trend-line (dashed blue-line) which has acted as a turning point for the trend strength in the past. This indicator can, however, continue to rise above the blue dashed-line like it did in 1998 (chart below).

Last week we wrote:
…the SPX gapped up to new highs, demonstrating undeniable strength. However, at this point, a check-back to close the gap is almost to be expected.
The SPX closed the gap, and then fell further.
{This section is for full members only. Consider joining us at www.angtraders.com}
Fundamental
The 10-year minus the 2-year Treasury rate differential continues to drop with a constant slope which implies an inversion at the end of this year. Recessions occur 6–18 months after an inversion, and after both the differential and the unemployment rate start to increase (note: the latter two indicators are not included in this week’s charts). At this point, the probability of a recession in the next 6-months is insignificant.
In addition to the 10-year minus 2-year rate differential, there is also the Fed funds rate to consider. Contrary to popular belief, rising interest rates do not kill bull markets. Too high interest rates kill the bull, and what the market considers too high has been decreasing in a geometric fashion since the early 80’s (red curve on chart below).
{This section is for full members only. Consider joining us at www.angtraders.com}
GAAP earnings and industrial production continue to grow and the employment situation continues to be solid (see introduction above). There are no fundamental weak spots raising any flags.

{This section is for full members only. Consider joining us at www.angtraders.com}
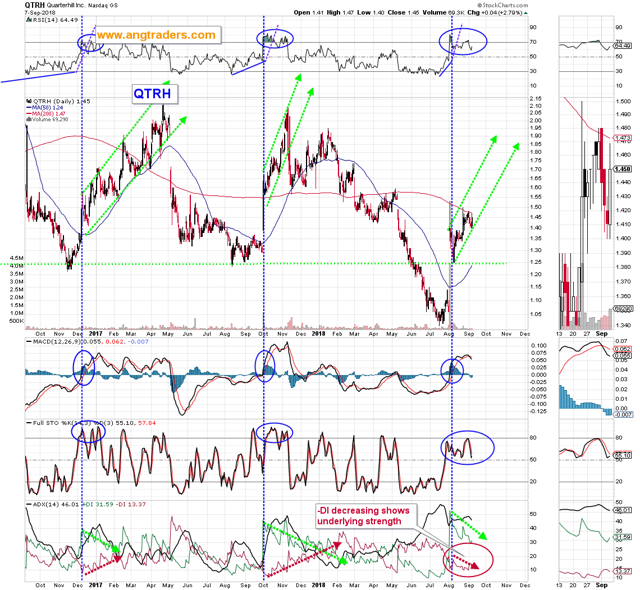
QTRH
The WiLAN division is still in closed dealings with Apple following a favorable $145 million court judgement. The intellectual property landscape, in general, is being transformed, and Apple’s obstinate legal behavior is starting to fail. The chances that WiLAN will come out of these negotiations with a settlement (and no appeal from Apple) are better than 50/50. This potential is not being priced into the stock at this point.
{This section is for full members only. Consider joining us at www.angtraders.com}
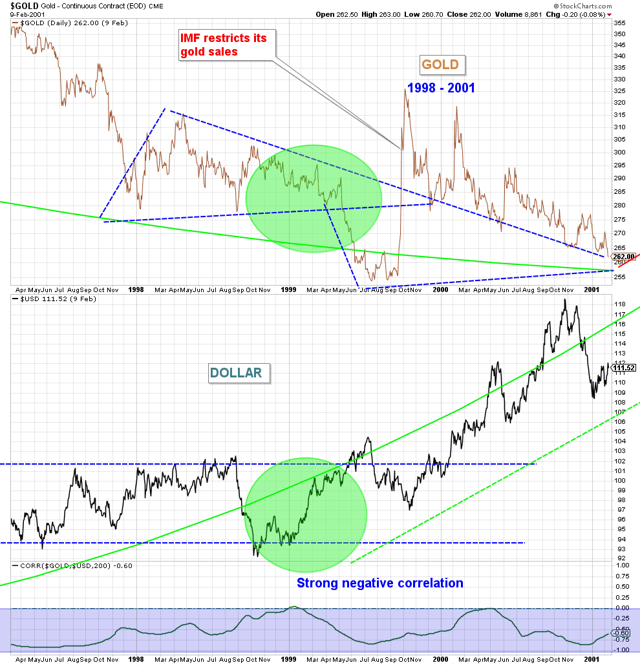
Gold
Gold continues to be a currency trade, especially with the dollar. The pattern of trade from 1999 seems to be replicating in 2018 (charts below). If this pattern continues, further pressure on gold is expected.

The Euro continues to correlate directly with gold. The balance of technical indicators are pointing to a lower Euro and, therefore, a lower gold price (chart below).

{This section is for full members only. Consider joining us at www.angtraders.com}
We wish our subscribers a profitable week ahead.
Join us at www.angtraders.com and replicate our trades and profits.
Regards,
ANG Traders
Email queries to [email protected]
Source: Nicholas Gomez