


Article updated August 2nd, 2019 by Ben Reynolds
Spreadsheet data updated weekly on Wednesdays
The Dividend Aristocrats are a select group of 57 S&P 500 stocks with 25+ years of consecutive dividend increases.
They are the ‘best of the best’ dividend growth stocks. The Dividend Aristocrats have a long history of outperforming the market.
The requirements to be a Dividend Aristocrat are:
- Be in the S&P 500
- Have 25+ consecutive years of dividend increases
- Meet certain minimum size & liquidity requirements
There are currently 57 Dividend Aristocrats. You can download an Excel spreadsheet of all 57 (with metrics that matter) by clicking the link below:
Note: On January 24th, 2019, Chubb (CB), Caterpillar (CAT), People’s United Financial (PBCT), and United Technologies (UTX) were added to the Dividend Aristocrats Index.
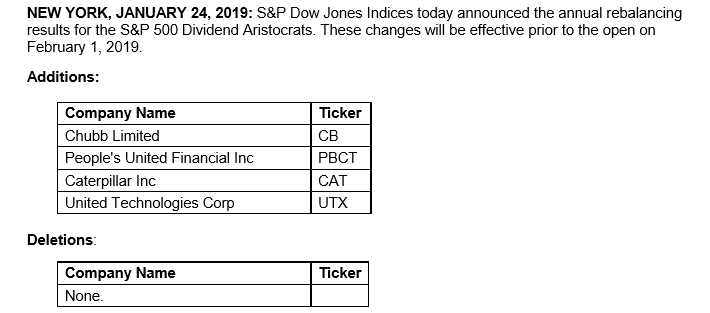
Source: S&P News Release
You can see detailed analysis on all 57 further below in this article, in our Dividend Aristocrats In Focus series. Analysis includes valuation, growth, and competitive advantage(s).
Table of Contents
- How To Use The Dividend Aristocrats List To Find Dividend Investment Ideas
- Performance
- Sector Overview
- Dividend Aristocrats Analysis (The Dividend Aristocrats In Focus Series)
- Historical Dividend Aristocrats List (1989 – 2015)
- Final Thoughts
You can also watch the following video for more information on the Dividend Aristocrats and see a table of the Dividend Aristocrats below.
| MMM | 3M Co. | 176.70 | 3.153 | 102,186 | 20.9 | 66.0 | 1.04 |
| AOS | A. O. Smith Corp. | 45.64 | 1.855 | 6,392 | 0.95 | ||
| ABT | Abbott Laboratories | 87.88 | 1.404 | 155,794 | 1.01 | ||
| ABBV | AbbVie, Inc. | 67.03 | 6.207 | 99,316 | 0.91 | ||
| AFL | Aflac, Inc. | 52.89 | 2.005 | 39,151 | 12.8 | 25.7 | 0.69 |
| APD | Air Products & Chemicals, Inc. | 230.60 | 1.950 | 51,080 | 29.7 | 57.9 | 0.81 |
| ADM | Archer-Daniels-Midland Co. | 41.02 | 3.309 | 22,938 | 14.0 | 46.4 | 0.71 |
| T | AT&T, Inc. | 34.31 | 5.939 | 249,684 | 14.4 | 85.5 | 0.67 |
| ADP | Automatic Data Processing, Inc. | 168.48 | 1.794 | 71,812 | 38.0 | 68.2 | 1.07 |
| BDX | Becton, Dickinson & Co. | 255.67 | 1.178 | 69,598 | 73.9 | 87.1 | 0.88 |
| BF.B | Brown-Forman Corp. | 54.81 | 1.176 | 26,311 | 31.4 | 37.0 | 0.78 |
| CAH | Cardinal Health, Inc. | 45.57 | 4.105 | 13,832 | 399.7 | 1,641.0 | 0.93 |
| CAT | Caterpillar, Inc. | 133.37 | 2.587 | 76,030 | 12.3 | 31.8 | 1.47 |
| CB | Chubb Ltd. | 153.69 | 1.918 | 70,196 | 0.57 | ||
| CVX | Chevron Corp. | 124.05 | 3.659 | 236,856 | 17.0 | 62.2 | 0.83 |
| CINF | Cincinnati Financial Corp. | 107.80 | 2.059 | 17,270 | 14.4 | 29.6 | 0.63 |
| CTAS | Cintas Corp. | 262.62 | 0.780 | 26,938 | 31.7 | 24.8 | 1.05 |
| CLX | The Clorox Co. | 165.45 | 2.325 | 21,037 | 26.7 | 62.1 | 0.40 |
| KO | The Coca-Cola Co. | 53.05 | 2.941 | 229,708 | 32.3 | 94.9 | 0.38 |
| CL | Colgate-Palmolive Co. | 72.97 | 2.261 | 64,127 | 27.7 | 62.7 | 0.51 |
| ED | Consolidated Edison, Inc. | 85.52 | 3.378 | 27,934 | 19.6 | 66.1 | 0.14 |
| DOV | Dover Corp. | 97.10 | 1.961 | 14,236 | 23.5 | 46.1 | 0.93 |
| ECL | Ecolab, Inc. | 205.21 | 0.870 | 59,285 | 39.5 | 34.4 | 0.77 |
| EMR | Emerson Electric Co. | 65.99 | 2.898 | 41,357 | 17.8 | 51.6 | 1.11 |
| XOM | Exxon Mobil Corp. | 75.34 | 4.353 | 318,812 | 17.4 | 75.6 | 0.82 |
| FRT | Federal Realty Investment Trust | 132.33 | 3.088 | 9,936 | 43.6 | 134.7 | 0.45 |
| BEN | Franklin Resources, Inc. | 33.61 | 2.986 | 17,039 | 12.4 | 37.1 | 0.96 |
| GD | General Dynamics Corp. | 188.00 | 2.062 | 54,626 | 16.5 | 34.1 | 0.95 |
| GPC | Genuine Parts Co. | 98.04 | 3.028 | 14,305 | 18.1 | 54.9 | 0.57 |
| HRL | Hormel Foods Corp. | 41.51 | 1.910 | 22,223 | 22.2 | 42.4 | 0.43 |
| ITW | Illinois Tool Works, Inc. | 155.41 | 2.566 | 50,785 | 20.8 | 53.3 | 1.08 |
| JNJ | Johnson & Johnson | 131.13 | 2.763 | 348,581 | 21.5 | 59.3 | 0.59 |
| KMB | Kimberly-Clark Corp. | 137.18 | 2.936 | 47,602 | 26.3 | 77.1 | 0.35 |
| LEG | Leggett & Platt, Inc. | 40.10 | 3.821 | 5,295 | 18.5 | 70.8 | 1.01 |
| LIN | Linde Plc | 194.08 | 1.705 | 106,653 | 18.1 | 30.9 | 0.77 |
| LOW | Lowe's Cos., Inc. | 103.07 | 1.850 | 81,243 | 35.2 | 65.2 | 1.07 |
| MKC | McCormick & Co., Inc. | 160.62 | 1.351 | 21,383 | 30.9 | 41.8 | 0.42 |
| MCD | McDonald's Corp. | 211.05 | 2.115 | 162,133 | 0.35 | ||
| MDT | Medtronic Plc | 103.75 | 1.928 | 139,145 | 30.2 | 58.1 | 0.67 |
| NUE | Nucor Corp. | 56.03 | 2.809 | 17,052 | 7.9 | 22.1 | 1.06 |
| PBCT | People's United Financial, Inc. | 16.40 | 4.222 | 6,631 | 12.5 | 52.8 | 0.78 |
| PNR | Pentair Plc | 38.95 | 1.823 | 6,543 | 18.2 | 33.2 | 1.01 |
| PEP | PepsiCo, Inc. | 129.85 | 2.864 | 182,433 | 14.3 | 40.9 | 0.41 |
| PPG | PPG Industries, Inc. | 118.87 | 1.614 | 28,109 | 23.3 | 37.6 | 0.81 |
| PG | Procter & Gamble Co. | 119.77 | 2.406 | 302,028 | 82.0 | 197.4 | 0.42 |
| ROP | Roper Technologies, Inc. | 363.28 | 0.491 | 38,093 | 33.5 | 16.4 | 0.97 |
| SPGI | S&P Global, Inc. | 244.36 | 0.856 | 59,534 | 32.5 | 27.8 | 1.02 |
| SHW | The Sherwin-Williams Co. | 515.98 | 0.773 | 47,513 | 40.7 | 31.4 | 0.89 |
| SWK | Stanley Black & Decker, Inc. | 149.58 | 0.000 | 22,975 | 31.3 | 0.0 | 1.40 |
| SYY | Sysco Corp. | 69.14 | 2.154 | 35,788 | 22.5 | 48.5 | 0.47 |
| TROW | T. Rowe Price Group, Inc. | 115.24 | 2.531 | 27,174 | 14.3 | 36.2 | 1.23 |
| TGT | Target Corp. | 87.25 | 2.947 | 44,511 | 15.1 | 44.6 | 0.81 |
| UTX | United Technologies Corp. | 135.59 | 2.147 | 116,741 | 21.9 | 47.0 | 1.02 |
| VFC | VF Corp. | 86.94 | 2.257 | 35,013 | 30.0 | 67.7 | 1.07 |
| GWW | W.W. Grainger, Inc. | 296.39 | 1.860 | 16,192 | 20.1 | 37.4 | 0.86 |
| WMT | Walmart, Inc. | 111.56 | 1.865 | 319,899 | 38.4 | 71.6 | 0.59 |
| WBA | Walgreens Boots Alliance, Inc. | 55.13 | 3.177 | 50,034 | 10.8 | 34.3 | 0.92 |
| Ticker | Name | Price | Dividend Yield | Market Cap ($M) | P/E Ratio | Payout Ratio | Beta |
How to Use The Dividend Aristocrats List To Find Dividend Investment Ideas
The downloadable Dividend Aristocrats Excel Spreadsheet List above contains the following for each stock in the index:
- Price-to-earnings ratio
- Dividend yield
- Market capitalization
All Dividend Aristocrats are high quality businesses based on their long dividend histories. A company cannot pay rising dividends for 25+ years without having a strong and durable competitive advantage.
But not all Dividend Aristocrats make equally good investments today. That’s where the spreadsheet in this article comes into play. You can use the Dividend Aristocrats spreadsheet to quickly find quality dividend investment ideas.
The list of all 57 Dividend Aristocrats is valuable because it gives you a concise list of all S&P 500 stocks with 25+ consecutive years of dividend increases (that also meet certain minimum size and liquidity requirements).
These are businesses that have both the desire and ability to pay shareholders rising dividends year-after-year. This is a rare combination.
Together, these two criteria are powerful – but they are not enough. Value must be considered as well.
The spreadsheet above allows you to sort by forward price-to-earnings ratio so you can quickly find undervalued, high quality dividend stocks.
Here’s how to use the Dividend Aristocrats list to quickly find high quality dividend growth stocks potentially trading at a discount:
- Download the list
- Sort by PE ratio, smallest to largest
- Research the top stocks further
Here’s how to do this quickly in the spreadsheet
Step 1: Download the list, and open it.
Step 2: Apply a filter function to each column in the spreadsheet.
Step 3: Click on the small gray down arrow next to ‘P/E Ratio”, and then click on ‘Descending’.
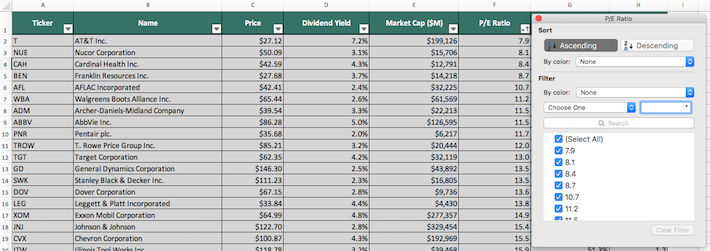
Step 4: Review the highest ranked Dividend Aristocrats before investing. You can see detailed analysis on every Dividend Aristocrat further below in this article.
That’s it; you can follow the same procedure to sort by any other metric in the spreadsheet.
This article examines the characteristics and performance of the Dividend Aristocrats in detail A table of contents for easy navigation is below.
Performance Through July 2019
In July of 2019, The Dividend Aristocrats, as measured by the Dividend Aristocrats ETF (NOBL), was virtually flat. It slightly underperformed The S&P 500 in the month.
- NOBL generated total returns of 0.2% in July of 2019
- SPY generated total returns of 06% in July of 2019
Performance between these 2 ETFs for the first 7 months of fiscal 2019 is below:
- NOBL has generated total returns of 16.6% through July
- SPY generated total returns of 20.1% through July
Short-term performance is mostly noise. Performance should be measured over a minimum of 3 years, and preferably longer periods of time.
The Dividend Aristocrats Index has outperformed the market by 1.4 percentage points annually over the last decade – with slightly lower volatility.

Source: S&P Fact Sheet
The performance of the Dividend Aristocrats by calendar year versus the S&P 500 is shown in the images below:
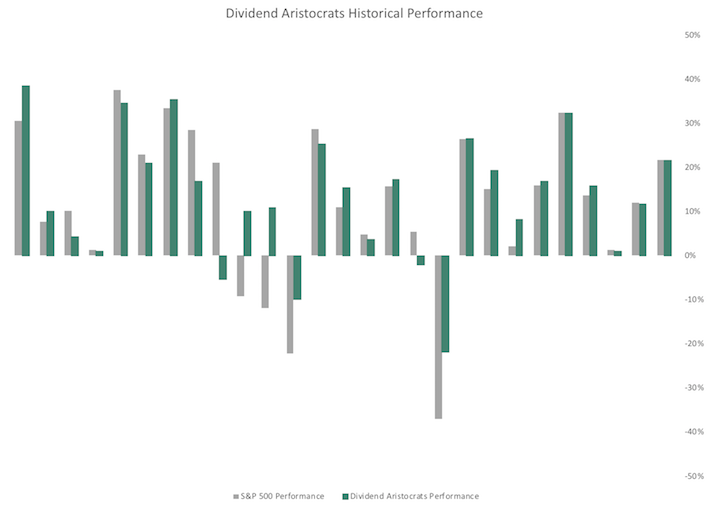
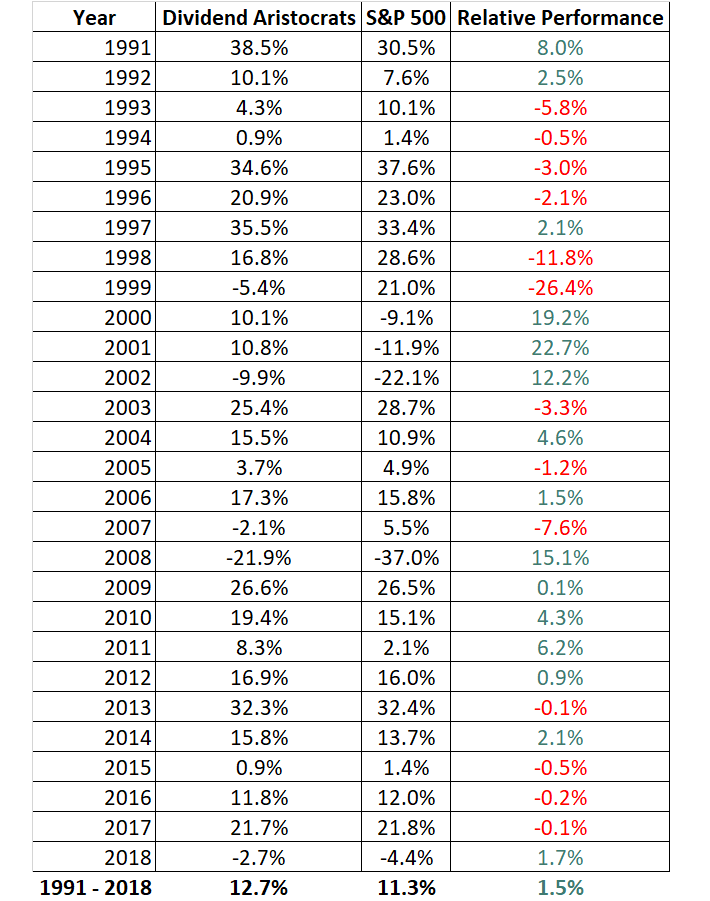
Source: Ploutos
The Dividend Aristocrats index has produced excellent risk-adjusted returns over the last 28 years, besting The S&P 500’s average returns over this time period.
Higher total returns with lower volatility is the ‘holy grail’ of investing. It is worth exploring the characteristics of the Dividend Aristocrats in detail to determine why they have performed so well.
Note that a good portion of the outperformance relative to the S&P 500 comes during recessions (2000 – 2002, 2008). Dividend Aristocrats have historically seen smaller drawdowns during recessions versus the S&P 500. This makes holding through recessions that much easier.
Case-in-point: In 2008 the Dividend Aristocrats Index declined 22%. The S&P 500 declined 38%. The performance of The Dividend Aristocrats Index in each year The S&P 500 generated negative total returns since 1991 is shown below.
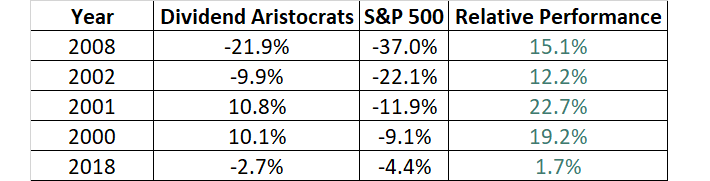
Great businesses with strong competitive advantages tend to be able to generate stronger cash flows during recessions. This allows them to gain market share while weaker businesses fight to stay alive.
Related: The video below shows the Great Recession performance of every Dividend Aristocrat (excluding the 4 new 2019 Aristocrats).
The Dividend Aristocrats Index has beaten the market over the last decade (and over the last 28 years)…I believe dividend paying stocks outperform non-dividend paying stocks for three reasons:
- A company that pays dividends is likely to be generating earnings or cash flows so that it can pay dividends to shareholders. This excludes ‘pre-earnings’ start-ups and failing businesses. In short, it excludes the riskiest stocks.
- A business that pays consistent dividends must be more selective with the growth projects it takes on because a portion of its cash flows are being paid out as dividends. Scrutinizing over capital allocation decisions likely adds to shareholder value.
- Stocks that pay dividends are willing to reward shareholders with cash payments. This is a sign that management is shareholder friendly.
In our view, Dividend Aristocrats have historically outperformed the market and other dividend paying stocks because they are, on average, higher quality businesses.
A high quality business should outperform a mediocre business over a long period of time, all other things being equal.
For a business to increase its dividends for 25+ consecutive years, it must have or at least had in the very recent past a strong competitive advantage.
Sector Overview
A sector breakdown of the Dividend Aristocrats index is shown below:

The top 3 sectors by weight in the Dividend Aristocrats are Consumer Staples, Industrials, and Financials. The weight of these sectors in the S&P 500 is shown below for comparison:
- Consumer Staples: 7.3%
- Industrials: 9.3%
- Financials: 13.2%
The Dividend Aristocrats Index is tilted toward Consumer Staples and Industrials relative to the S&P 500. These 2 sectors make up 45.6% of The Dividend Aristocrats Index, but just 16.7% of The S&P 500.
The Dividend Aristocrats Index is also significantly underweight the Information Technology sector; with a 1.8% allocation versus a 21.8% allocation for The S&P 500.
The Dividend Aristocrat Index is filled with stable ‘old economy’ blue chip consumer products businesses and manufacturers; the 3M’s (MMM), Coca-Cola’s (KO), and Johnson & Johnson’s (JNJ) of the investing world. These ‘boring’ businesses aren’t likely to generate 20%+ earnings-per-share growth, but they also are very unlikely to see large earnings drawdowns as well.
The Dividend Aristocrats In Focus Analysis Series
You can see analysis on every single Dividend Aristocrat below. Each is sorted by GICS sectors and listed in alphabetical order by name:
Consumer Staples
- Archer-Daniels-Midland (ADM)
- Brown-Forman (BF-B)
- Colgate-Palmolive (CL)
- Clorox (CLX)
- Coca-Cola (KO)
- Hormel Foods (HRL)
- Kimberly-Clark (KMB)
- McCormick & Company (MKC)
- PepsiCo (PEP)
- Procter & Gamble (PG)
- Sysco Corporation (SYY)
- Wal-Mart (WMT)
- Walgreens Boots Alliance (WBA)
Industrials
- A.O. Smith (AOS)
- Cintas (CTAS)
- Dover (DOV)
- Emerson Electric (EMR)
- Illinois Tool Works (ITW)
- 3M (MMM)
- Pentair (PNR)
- Roper Technologies (ROP)
- Stanley Black & Decker (SWK)
- W.W. Grainger (GWW)
- General Dynamics (GD)
- Caterpillar (CAT)
- United Technologies (UTX)
Health Care
- Abbott Laboratories (ABT)
- AbbVie (ABBV)
- Becton, Dickinson & Company (BDX)
- Cardinal Health (CAH)
- Johnson & Johnson (JNJ)
- Medtronic (MDT)
Consumer Discretionary
- Genuine Parts Company (GPC)
- Leggett & Platt (LEG)
- Lowe’s (LOW)
- McDonald’s (MCD)
- Target (TGT)
- V.F. Corporation (VFC)
Financials
- Aflac (AFL)
- Cincinnati Financial (CINF)
- Franklin Resources (BEN)
- S&P Global (SPGI)
- T. Rowe Price Group (TROW)
- Chubb (CB)
- People’s United Financial (PBCT)
Materials
- Air Products and Chemicals (APD)
- Ecolab (ECL)
- PPG Industries (PPG)
- Sherwin-Williams (SHW)
- Nucor (NUE)
- Linde (LIN)
Energy
Information Technology
Real Estate
Telecommunication Services
Utilities
Looking for no-fee DRIP Dividend Aristocrats? This article examines all 15 no-fee DRIP Dividend Aristocrats in detail.
Historical Dividend Aristocrats List
(1989 – 2019)
The image below shows the history of the Dividend Aristocrats Index from 1989 through 2019:
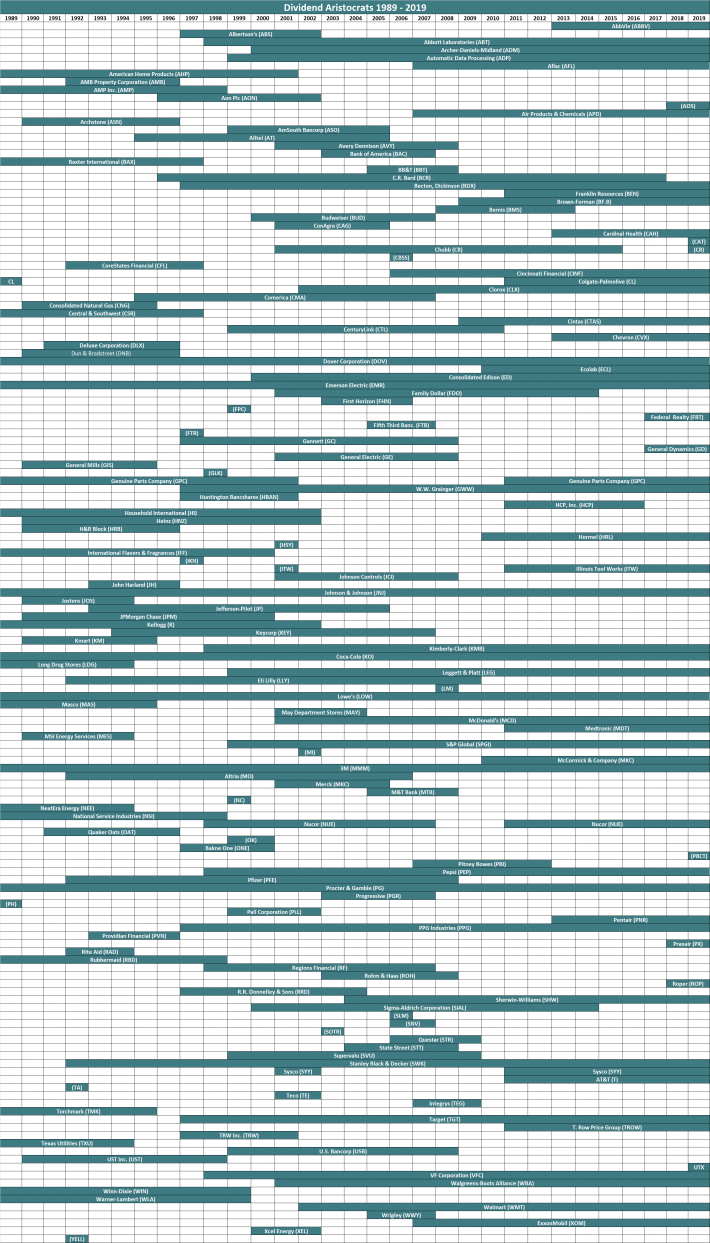
Note: CL, GPC, and NUE were all removed and re-added to the Dividend Aristocrats Index through the historical period analyzed above. We are unsure as to why. Companies created via a spin-off (like AbbVie) can be Dividend Aristocrats with less than 25 years of rising dividends if the parent company was a Dividend Aristocrat.
This information was compiled from the following sources:
- 1989 – 1991: Dividend Growth Investor
- 1992 – 2015: NOBL Index Historical Constituents
- 2016: Sure Dividend update
- 2017 – 2019: Data from S&P press releases
Other Dividend Lists & Final Thoughts
The Dividend Aristocrats list is not the only way to quickly screen for businesses that regularly pay rising dividends.
- The Dividend Achievers List is comprised of more than 250 businesses with 10+ years of consecutive dividend increases.
- The Dividend Kings List is even more exclusive than the Dividend Aristocrats. It is comprised of less than 20 businesses with 50+ years of consecutive dividend increases.
- The Sure Dividend Blue Chip Stocks List
- The High Dividend Stocks List
- The Monthly Dividend Stocks List
There is nothing magical about the Dividend Aristocrats. They are ‘just’ a collection of high quality shareholder friendly businesses that have strong competitive advantages.
Purchasing this type of business at fair or better prices and holding for the long-run will likely result in favorable long-term performance.
You have a choice in what type of business you buy into. You can buy into the mediocre, or the excellent.
Often, excellent businesses are not more expensive (based on their price-to-earnings ratio) than mediocre businesses.
“When we own portions of outstanding businesses with outstanding managements, our favorite holding period is forever.”