

Digging Down on the Trump Effect

We have a reasonable volume of economic data, but few important reports. We are awaiting earnings season. The elephant in the room (sorry – I just couldn’t help myself) is the transition to the Trump Administration. Many are tired of hearing about this and thinking about the consequences, but that is not a sound plan for the intelligent investor. The punditry is far from exhausting this topic. They are making their own transition from Candidate Trump to President Trump. In the coming week, the punditry will be asking:
What can investors really expect under Trump?
Last Week
Last week the economic news was strong, but with little reaction from stocks.
Theme Recap
In my last WTWA I predicted a focus on more reaction to PEOTUS versus the regular Santa Claus rally. Despite all the economic data, that was in fact a popular topic. Go figure.
The Story in One Chart
I always start my personal review of the week by looking at this great chart from Doug Short. He captures the story for the week and the continuing narrow range.
(click to enlarge)
Doug has a special knack for pulling together all the relevant information. His charts save more than a thousand words! Read his entire post where he adds analysis grounded in data and several more charts providing long-term perspective.
The News
Each week I break down events into good and bad. Often there is an “ugly” and on rare occasion something very positive. My working definition of “good” has two components. The news must be market friendly and better than expectations. I avoid using my personal preferences in evaluating news – and you should, too!
This week’s news was quite good-almost all positive. I make objective calls, which means not stretching to achieve a false balance. If I missed something for the “bad” list, please feel free to suggest it in the comments.
The Good
- Chemical activity ends the year strongly. Get the full story and a helpful table of the relevant data at GEI.
- Construction spending was up 0.9%, to the highest level in ten years. (Washington Post). According to our go-to source, Calculated Risk, it was another solid report.
- Earnings pre-announcements were more positive than usual in Q416. (FactSet).
- Home loan originations are stronger than they were one year ago. (CoreLogic via GEI).
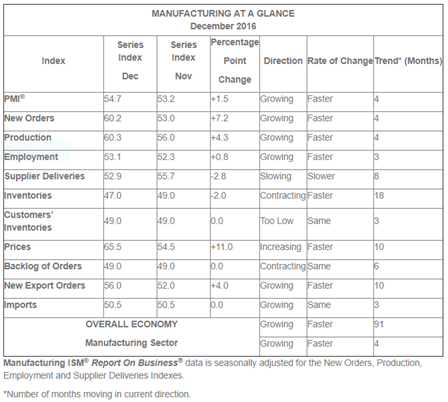
- ISM manufacturing reached 54.7, the highest level in two years. The ISM also has a strong interpretation of the data, headlining their press release with some leading indicators and including a supporting table.
New Orders, Production and Employment Growing
Inventories Contracting
Supplier Deliveries Slowing
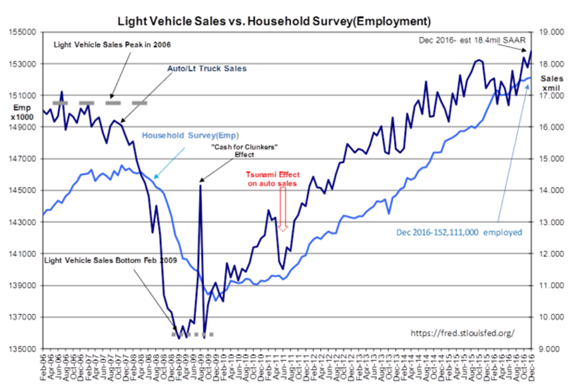
- Auto Sales were strong, reflecting the overall economy. “Davidson” (via Todd Sullivan) discusses the data, some of the credit relationships, and this interesting relationship with employment.
-
Employment data showed continuing strength. Some call the Friday data “weak.” Those were the headlines in the morning, right after the market opened. When stocks closed higher, the headlines changed —- referring to the same data. I had to put the mute on as the punditry tried to draw inferences from a 20K miss when there is 120K sampling error – plus revisions. There were both good points and weak points in last week’s data.
- Good
- Employment growth remains consistent with moderate economic growth
- Unemployment remains very low
- Wages have started to increase, something that critics have called necessary for the last few years.
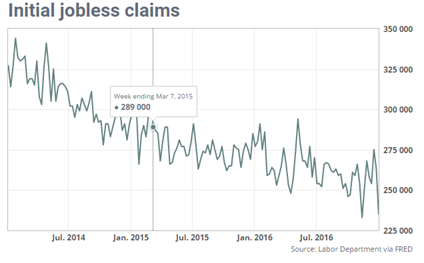
- Initial jobless claims tumbled again, close to a 43-year low (Jeff Bartash, MarketWatch)
- Good
- Weak
- ADP private payroll growth, which I view as important, declined 60K from the prior month and missed expectations by 20K.
- The headline payroll gain was also a 20K miss from expectations.
The WSJ has a nice chart pack that is republished in several places. Take a look here.
The Bad
- Factory orders declined 2.4% on a monthly basis, but it was mostly noise from transportation changes.
- Mortgage applications turn negative. New Deal Democrat’s valuable high frequency indicators highlight this news, but you should read the entire post.
Bitcoin. Not that long ago the debate was whether this would work as a substitute currency. Last week it dropped 20% in a single day. Yes, that followed a 40% increase in the prior two weeks. It is still more like leveraged commodities trading than a currency. (Reuters).
The Silver Bullet
I occasionally give the Silver Bullet award to someone who takes up an unpopular or thankless cause, doing the real work to demonstrate the facts. This week’s award goes to KraneShares for an excellent post taking on several popular misconceptions about China – ghost cities, currency manipulation, and the significance of manufacturing weakness. I find their KWEB product a good way to invest in China despite limited knowledge about individual stocks – or confidence in reports and accounting. The conclusions are not just opinions of the fund managers. Here is one example:
Stephen Roach, former Morgan Stanley Chief Economist and Senior Fellow at Yale University’s Jackson Institute for Global Affairs, once said that China’s modernization is “the greatest urbanization story the world has ever seen” and that ghost cities will soon become “thriving metropolitan areas1.” Regardless of what Mr. Roach, and many other China scholars, have said the notion of widespread Ghost Cities in China has persisted with many US investors.
The Week Ahead
We would all like to know the direction of the market in advance. Good luck with that! Second best is planning what to look for and how to react. That is the purpose of considering possible themes for the week ahead. You can make your own predictions in the comments.
The Calendar
It is back to normal for the volume of economic data, but fewer of the most important reports.
The “A” List
- Retail sales (NYSE:F). There is great interest in the December results, particularly after weak reports from some big players.
- Michigan sentiment . Continuing strength in January?
- Initial claims (Th). The best concurrent indicator for employment trends.
The “B” List
- JOLTS report (NYSE:T). Important as a read on the structure of the labor market, not some macro indicator as usually cited.
- PPI . Interest in the inflation reports is building, but the worrisome stages are not imminent.
- Consumer credit (NYSE:M). The big increase expected in November will get plenty of spin.
- Business inventories . Volatile November data, but relevant for the Q4 GDP calculation. Another spin candidate.
- Wholesale inventories . See Business Inventories (above).
- Crude inventories (NYSE:W). Recently showing even more impact on oil prices. Rightly or wrongly, that spills over to stocks.
Fed speakers are out in force this week, including Chair Yellen. Enjoy!
Next Week’s Theme
Like it or not, the market focus on Trump is continuing. It is not my job to pick what I want others to think about. The purpose of WTWA is to help us all prepare, whether we like the current topics or not. Without much fresh data, expect another round of punditry about Trump. It might get a little stronger, with more people engaged in:
Digging Down on the Trump Effect
The initial discussion on the post-election effect is already
The post Digging Down on the Trump Effect appeared first on ValueWalk.
Source: valuewalk