


Updated on November 25th, 2019 by Nate Parsh
When it comes to dividend investing, the Dividend Aristocrats are the “cream of the crop.” The Dividend Aristocrats are stocks in the S&P 500 Index, with 25+ consecutive years of dividend increases. There are just 57 companies that have attained Dividend Aristocrat status.
In addition to the full downloadable spreadsheet, you can see a preview of the Dividend Aristocrats list in the table below:
| 3M Co. | 167.60 | 3.4 | 96,378 | 19.6 | 66.4 | 1.08 |
| A. O. Smith Corp. | 48.20 | 1.8 | 6,606 | 19.9 | 36.3 | 0.91 |
| Abbott Laboratories | 83.74 | 1.5 | 148,002 | 45.1 | 68.9 | 1.06 |
| AbbVie, Inc. | 86.05 | 5.0 | 127,252 | 39.5 | 196.3 | 0.88 |
| Aflac, Inc. | 53.99 | 2.0 | 39,629 | 13.3 | 26.3 | 0.71 |
| Air Products & Chemicals, Inc. | 237.60 | 1.9 | 52,356 | 29.8 | 57.4 | 0.81 |
| Archer-Daniels-Midland Co. | 42.72 | 3.2 | 23,781 | 20.2 | 65.5 | 0.81 |
| AT&T, Inc. | 37.75 | 5.4 | 275,763 | 16.9 | 91.0 | 0.61 |
| Automatic Data Processing, Inc. | 169.65 | 1.9 | 73,407 | 31.0 | 57.8 | 1.02 |
| Becton, Dickinson & Co. | 249.89 | 1.2 | 67,458 | 63.0 | 77.7 | 0.99 |
| Brown-Forman Corp. | 67.04 | 1.0 | 32,014 | 39.1 | 38.2 | 0.71 |
| Cardinal Health, Inc. | 55.69 | 3.4 | 16,288 | -4.0 | -13.6 | 0.92 |
| Caterpillar, Inc. | 143.88 | 2.5 | 79,516 | 13.5 | 34.0 | 1.38 |
| Chubb Ltd. | 151.13 | 2.0 | 68,492 | 19.0 | 37.2 | 0.63 |
| Chevron Corp. | 118.63 | 4.0 | 224,313 | 16.9 | 66.8 | 0.85 |
| Cincinnati Financial Corp. | 105.75 | 2.1 | 17,276 | 18.8 | 39.3 | 0.72 |
| Cintas Corp. | 254.09 | 1.0 | 26,298 | 29.2 | 29.3 | 1.01 |
| The Clorox Co. | 146.26 | 2.8 | 18,356 | 22.9 | 63.2 | 0.45 |
| The Coca-Cola Co. | 53.03 | 3.0 | 227,206 | 29.3 | 87.9 | 0.43 |
| Colgate-Palmolive Co. | 66.71 | 2.5 | 57,173 | 24.7 | 62.9 | 0.54 |
| Consolidated Edison, Inc. | 86.19 | 3.4 | 28,652 | 20.3 | 69.0 | 0.24 |
| Dover Corp. | 109.48 | 1.8 | 15,903 | 24.5 | 43.1 | 1.07 |
| Ecolab, Inc. | 182.51 | 1.0 | 52,607 | 34.5 | 34.8 | 0.80 |
| Emerson Electric Co. | 73.66 | 2.7 | 44,870 | 19.7 | 52.3 | 1.17 |
| Exxon Mobil Corp. | 69.37 | 4.9 | 293,512 | 20.2 | 98.5 | 0.92 |
| Federal Realty Investment Trust | 130.34 | 3.2 | 9,925 | 38.7 | 122.1 | 0.52 |
| Franklin Resources, Inc. | 27.32 | 3.8 | 13,607 | 11.6 | 44.1 | 1.11 |
| General Dynamics Corp. | 182.88 | 2.2 | 52,908 | 15.7 | 34.2 | 0.91 |
| Genuine Parts Co. | 103.71 | 2.9 | 15,068 | 19.0 | 55.0 | 0.78 |
| Hormel Foods Corp. | 42.31 | 1.9 | 22,592 | 23.0 | 44.3 | 0.48 |
| Illinois Tool Works, Inc. | 173.56 | 2.3 | 55,783 | 22.8 | 53.3 | 1.20 |
| Johnson & Johnson | 138.07 | 2.7 | 363,382 | 26.0 | 69.7 | 0.61 |
| Kimberly-Clark Corp. | 133.53 | 3.1 | 45,774 | 22.7 | 69.7 | 0.46 |
| Leggett & Platt, Inc. | 52.33 | 3.0 | 6,886 | 23.5 | 70.0 | 1.08 |
| Linde Plc | 204.91 | 1.7 | 110,072 | 21.0 | 35.3 | 0.78 |
| Lowe's Cos., Inc. | 118.20 | 1.7 | 90,777 | 31.2 | 54.4 | 1.04 |
| McCormick & Co., Inc. | 166.91 | 1.3 | 22,184 | 31.4 | 41.9 | 0.40 |
| McDonald's Corp. | 193.14 | 2.4 | 145,452 | 25.1 | 60.3 | 0.43 |
| Medtronic Plc | 110.82 | 1.9 | 148,540 | 31.8 | 59.7 | 0.67 |
| Nucor Corp. | 55.24 | 2.9 | 16,749 | 9.4 | 27.3 | 1.15 |
| People's United Financial, Inc. | 16.30 | 4.3 | 7,239 | 12.4 | 53.6 | 0.96 |
| Pentair Plc | 43.73 | 1.6 | 7,350 | 21.2 | 34.7 | 1.20 |
| PepsiCo, Inc. | 134.07 | 2.8 | 186,951 | 15.2 | 42.7 | 0.53 |
| PPG Industries, Inc. | 125.41 | 1.6 | 29,654 | 24.6 | 38.3 | 0.90 |
| Procter & Gamble Co. | 120.29 | 2.4 | 299,980 | 74.7 | 181.8 | 0.53 |
| Roper Technologies, Inc. | 355.75 | 0.5 | 37,018 | 32.0 | 16.6 | 1.04 |
| S&P Global, Inc. | 265.21 | 0.8 | 64,817 | 31.3 | 26.0 | 0.99 |
| The Sherwin-Williams Co. | 574.83 | 0.7 | 53,061 | 37.9 | 28.0 | 0.87 |
| Stanley Black & Decker, Inc. | 157.28 | 1.7 | 23,908 | 33.8 | 57.3 | 1.53 |
| Sysco Corp. | 79.06 | 2.0 | 40,338 | 23.9 | 47.2 | 0.51 |
| T. Rowe Price Group, Inc. | 121.02 | 2.5 | 28,279 | 15.2 | 37.3 | 1.22 |
| Target Corp. | 127.02 | 2.0 | 64,358 | 20.1 | 41.2 | 0.85 |
| United Technologies Corp. | 147.70 | 2.0 | 127,479 | 24.7 | 49.2 | 1.09 |
| VF Corp. | 86.51 | 2.3 | 34,549 | 26.6 | 60.3 | 1.14 |
| W.W. Grainger, Inc. | 319.00 | 1.8 | 17,183 | 18.5 | 32.5 | 1.07 |
| Walmart, Inc. | 119.36 | 1.8 | 339,493 | 23.7 | 41.9 | 0.61 |
| Walgreens Boots Alliance, Inc. | 60.60 | 2.9 | 54,087 | 14.1 | 41.2 | 1.03 |
| Name | Price | Dividend Yield | Market Cap ($M) | Forward P/E Ratio | Payout Ratio | Beta |
There are thousands of stocks to choose from, many of which pay dividends. But the Dividend Aristocrats have profitable businesses, and the ability to grow their profits. This gives them the ability to withstand recessions, and continue increasing their dividends each year.
Franklin Resources (BEN) has increased its dividend for 39 years. The stock has a dividend yield of 3.8% and regularly increases its dividend by 10% or more per year. For example, the company raised its dividend by 13% at the end of 2018.
After returning to growth last year, Franklin Resources struggled in fiscal 2019. This could limit its dividend increase for the upcoming raise. Still, given the company’s track record of dividend growth and current yield, Franklin Resources could be an attractive stock for income seeking investors.
Business Overview
Franklin Resources is an investment management company. It was founded in 1947 in New York, by Rupert H. Johnson Sr., who had previously managed a Wall Street brokerage firm. He named the company after Benjamin Franklin, the founding father who was viewed as a symbol for frugality, saving, and wise investments.
Today, Franklin Resources manages the Franklin and Templeton families of mutual funds. The past few years have been difficult for Franklin Resources. When funds do poorly, investors take their money elsewhere. This has caused Franklin Resources’ fundamental deterioration of revenue and earnings.
Its fundamentals have worsened in recent years. The following image shows Franklin Resources’ struggles to keep earnings afloat in the difficult operating climate over the past five years.
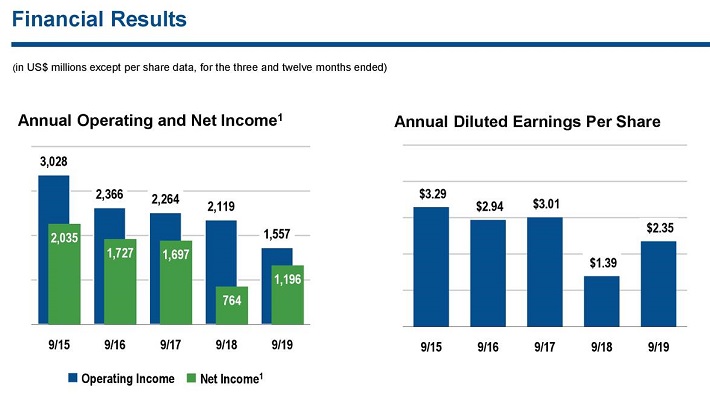
Source: Investor Presentation
Results declined moderately in fiscal 2019, as Franklin Resources’ AUM declined 3% to $692.6 billion year-over-year. Much of this decline was due to outflows and market volatility.
Looking back, investors should note that Franklin Resources’ assets under management exceeded $880 billion at the end of 2014. As a result, the company has a long way to go to regain the ground it has lost.
Growth Prospects
Despite the difficult operating environment, there are reasons to be optimistic about the company’s long-term growth. The U.S. is an aging population. There are thousands of Baby Boomers retiring every day. Combined with rising life expectancy, there is a great need for investment planning.
There should always be a need for the financial services provided by Franklin Resources. The company has seen assets under management increase as recently as 2017.
In the short term, the company could see continued difficulty. Franklin Resources saw revenue decline 9% due to lower average assets and lower average fees in the company’s fourth quarter. Earnings-per-share declined 36% year-over-year, despite a lower share count and tax rate. For the year, earnings-per-share declined 25% from fiscal year 2018.
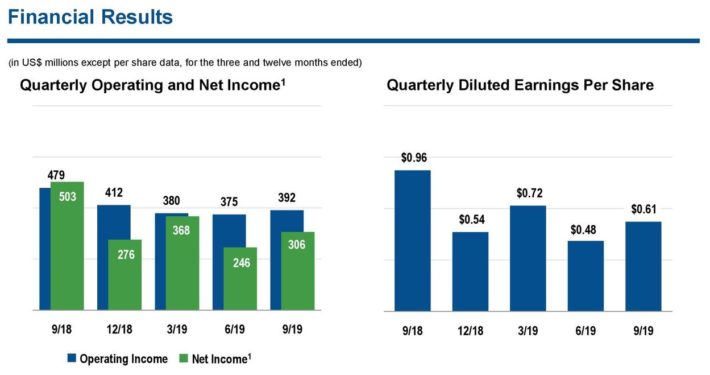
Source: Investor Presentation
Franklin Resources is attempting to remedy its issues. For example, it is hoping acquisitions will jump-start its growth. The company announced that it agreed to acquire alternative credit manager Benefit Street for an undisclosed sum. Benefit Street has $26 billion in assets under management.
Franklin Resources reduced its diluted share count by 4% in fiscal 2019, which helps boost earnings-per-share. We expect the share count to decline another 2% in fiscal 2020.
Accretion to earnings is even stronger when the price of a stock declines. This is an advantage of consistent profitability—the company can use short-term dips in the share price as an opportunity to buy back its own stock.
Given the decline in AUM, we feel investors can reasonable expect 2% earnings growth over the next five years.
Competitive Advantages & Recession Performance
Asset management is a highly competitive business, and there are not many competitive advantages in the financial services industry. The ability to retain clients depends largely on performance. If funds perform worse than their benchmarks, clients typically see a need to withdraw their funds.
However, Franklin Resources does have a few advantages going for it. The first, and perhaps most important, is brand recognition. Franklin Resources has been in operation for 70 years. That indicates a certain developed expertise and some innate investment abilities. Franklin Resources also still has huge assets under management, allowing the company to offer a wide range of investment opportunities to clients and generate some economies of scale.
Counterbalancing these advantages, Franklin Resources most recent recession performance was poor:
- 2007 earnings-per-share of $2.37
- 2008 earnings-per-share of $2.24 (5.5% decline)
- 2009 earnings-per-share of $1.30 (42% decline)
- 2010 earnings-per-share of $2.12 (63% increase)
As you can see, earnings-per-share fell steeply in 2009 during the worst part of the Great Recession. This should come as no surprise, since investing is hardly recession-resistant. During recessions, stock markets typically decline. For asset managers, this can lower assets under management and fees. That said, Franklin Resources recovered quickly, and saw earnings jump in 2010 and thereafter.
During recessions, stock markets typically decline. This prompts many investors to sell their stocks out of fear, which causes lower assets under management and fees. That said, Franklin Resources recovered quickly, and saw earnings jump in 2010 and thereafter.
Valuation & Expected Returns
While Franklin Resources’ fundamentals have worsened in recent years The good news is potential investors in Franklin Resources are not paying a high price for the stock.
We expect that Franklin Resources will earn $2.75 per share in fiscal year 2019. Based off the current share price of $27, the stock has a price-to-earnings ratio of 9.8. This is well below the S&P 500, which has an average price-to-earnings ratio of 23.
If the company can grow its asset under management either through acquisition or improvement in its core business, the stock could see its price-to-earnings ratio rise to 11 by fiscal 2025. If shares were to reach our target price-to-earnings ratio by 2025, then valuation would add 2.3% to annual returns over this period of time.
If Franklin Resources can recover and return to earnings growth, the current price could prove to be a good value. An expanding price-to-earnings ratio could generate significant returns.
Franklin Resources has an attractive dividend yield of 3.8%, and the dividend payout appears to be secure. A breakdown of potential returns is as follows:
- 2.0% earnings growth
- 3.8% dividend yield
- 2.3% valuation expansion
If Franklin Resources can return to growth investors buying the stock now could see annual returns of 8.1% over the next five years.
Final Thoughts
Franklin Resources’ assets under management again declined in 2019. It will likely take some time to recover what it has lost, but the company is still growing earnings, thanks to share buybacks. And, the stock offers a 3.8% dividend yield and the potential for annual dividend increases.
With a low valuation, generous yield and possibility of a higher valuation down the road, Franklin Resources could be attractive for value and dividend growth investors.
However, given projected returns, investors interested in the stock are encouraged to wait for a pullback or an improvement in fundamentals before buying Franklin Resources. As such, the stock receives a hold recommendation.