


Updated on January 23rd, 2019 by Nate Parsh
Every year, we publish an in-depth look at each of the 53 Dividend Aristocrats, an exclusive list of stocks in the S&P 500 Index, with 25+ years of consecutive dividend increases.
Next in line in our annual series is S&P Global (SPGI).
S&P Global might fly under the radar of most income investors, but it has a very impressive dividend track record. It has paid a dividend each year since 1937.
And, S&P Global has increased its dividend for 45 years in a row. According to the company, it is one of fewer than 25 companies in the S&P 500, that has increased its dividend for at least 45 consecutive years.
This article will take a closer look at S&P Global, and what makes it such a high-quality dividend growth stock.
Business Overview
S&P Global traces its roots back to 1917, when McGraw Publishing Company and the Hill Publishing Company came together. The company was first named McGraw Hill Financial. In 1957, McGraw Hill introduced the S&P 500.
S&P Global has a very strong business model. The company has generated impressive growth rates over the past several years.
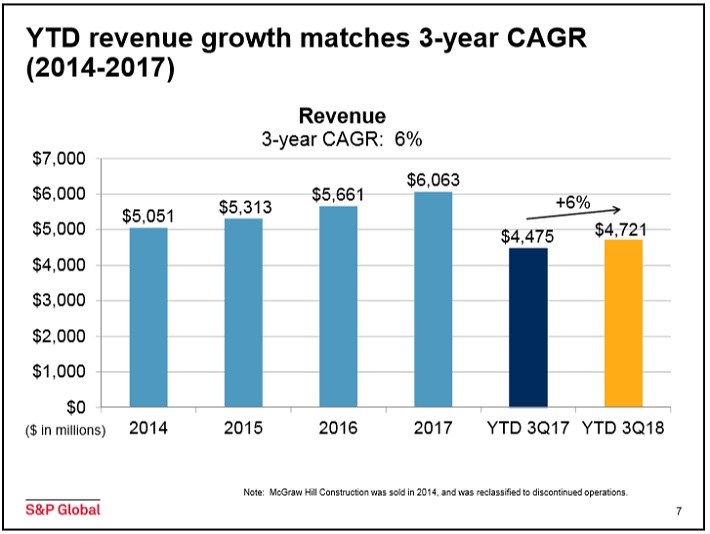
Source: Investor Presentation
Today, the S&P 500 is arguably the most widely-known stock market index in the world. The company generates more than $6 billion in annual revenue, with 20,000 employees. The company’s has a current market cap of $46 billion.
S&P Global’s business performed very well during the third quarter (10/25/2018). The company had earnings-per-share of $2.11, which was a 23% improvement from the previous year. This result also beat estimates by $0.07. Revenue increased just 2% to $1.55 billion, missing estimates by $40 million.
While revenue growth was tepid, the S&P Global’s margins did expand by 8% year-over-year.
S&P Global offers financial services, including credit ratings, benchmarks, analytics, and data, to the global capital and commodity markets.
It derives revenue from four operating segments: Ratings, Market Intelligence, Platts, and S&P Dow Jones Indices.
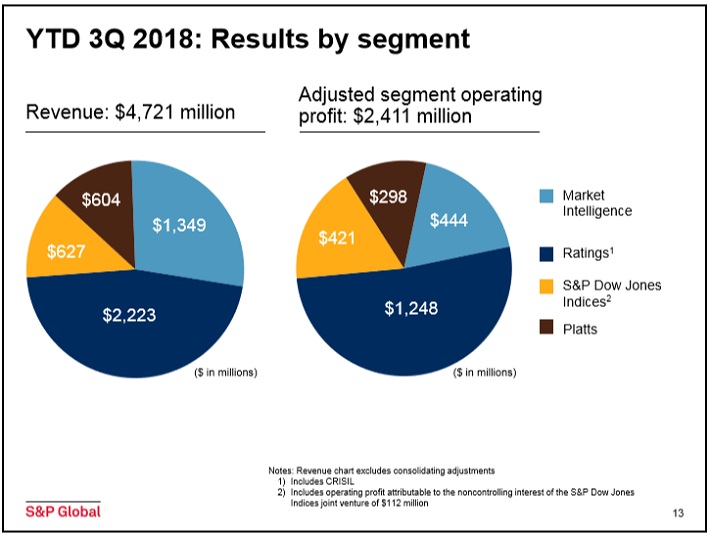
Source: Investor Presentation
S&P Global has a highly profitable business model. It is the industry leader in credit ratings and stock market indexes, which provide it with high profit margins and growth opportunities.
Growth Prospects
S&P Global has significant catalysts for future growth. The global economy continues to expand, which fuels greater demand for financial analysis and debt ratings, which is crucial information for investors.
Ratings revenue continues to rise at a steady pace, and took only a modest dip during the Great Recession.
Through the first three quarters of 2018, S&P Global’s adjusted earnings-per-share has increased 24.4% from the previous year while revenues have improved 5.1%. These year-over-year results are in line with 2017’s growth totals.
Share repurchases contributed 2% to adjusted earnings-per-share growth in the third quarter, but gains due to U.S. tax reform added 11%. Almost half of the company’s adjusted earnings-per-share growth came from a lower tax rate.
Divestitures and acquisitions have helped fuel growth. The company has sold off low-growth businesses, and reinvested in new areas. Its many divestitures include J.D. Power, the SPSE/CMA pricing businesses, QuantHouse, and equity and fund research in 2017. S&P Global also acquired PIRA and RigData last year.
Ratings revenue declined 5% due to lower revenues from product transactions and a drop in bank loan rating activity.
Market Intelligence revenue improved by 10%, with gains in Risk Services and Data Management Solutions being the primary driver off growth.
Lastly, S&P Dow Jones Indices revenue increased 10% last quarter, due to a 11% increase in asset-linked fees. This primarily includes revenue from exchange-traded funds. Assets under management associated with S&P Global’s indexes climbed 23% for the quarter. Revenue associated with data and subscriptions was higher by 12%
For 2018, S&P Global expected adjusted earnings-per-share of $8.55, up from $8.53 previously. This would represent 24% growth from the previous year if achieved. We expect annual earnings-per-share growth of 10% through 2023, as the year-over-year gains from a lower tax rate will begin to subside in future years.
Competitive Advantages & Recession Performance
S&P Global enjoys multiple competitive advantages. First, it operates in a highly concentrated industry. It is one of only three major credit ratings agencies in the U.S., along with Moody’s (MCO) and Fitch Ratings.
Put together, these three companies control over 90% of the global financial debt rating industry, with S&P Global on top. And, there are high barriers to entry. Clients pay S&P Global hefty sums for investment research, as S&P Global has built a strong reputation over its many decades of business.
These competitive advantages helped the company remain consistently profitable throughout the Great Recession:
- 2007 earnings-per-share of $2.94
- 2008 earnings-per-share of $2.51 (15% decline)
- 2009 earnings-per-share of $2.33 (7% decline)
- 2010 earnings-per-share of $2.65 (14% increase)
S&P Global’s earnings declined in 2008 and 2009, as investors should expect the company to struggle during recessions. A global recession will naturally result in lower demand for financial services, as investors exit the markets.
That said, S&P Global quickly bounced back after the recession ended. By 2011, earnings-per-share had hit a new post-recession high.
Valuation & Expected Returns
S&P Global currently trades at $185 per share. Using the company’s adjusted earnings-per-share guidance for the year of $8.55, the stock has a price-to earnings ratio of 21.6. This is higher than the stock’s five-year average price-to-earnings ratio of 20.8. If shares were to retreat to this valuation by 2023, investors would see a reduction in annual returns of 0.8%.
A potential bull-case breakdown of future returns is as follows:
- 10% adjusted earnings-per-share growth
- 1.2% dividend yield
- 0.8% multiple reversion
We expect that S&P Global can offer a total return of 10.4% per year through 2023. The stock is down almost 15% from its 52-week high. While S&P Global’s yield is almost half that of the S&P 500, the stock does offer the potential for annual double-digit returns going forward.
Final Thoughts
S&P Global is a strong business, with a long runway of growth up ahead. There will always be a need for financial ratings services. And, future growth potential is strong in new areas like data and financial technology. S&P Global’s acquisitions will accelerate its growth in these segments.
The dividend yield of 1.2% might not be attractive to income investors, but dividend growth investors should view the stock favorably. The company has increased its dividend by 10% per year, over the past five years. S&P Global announced a 22% dividend increase last February. The expected payout ratio for 2018 is under 24%.
Investors looking for double digit annual returns and dividend growth are encouraged to consider buying shares of S&P Global, with the acknowledgement that shares are slightly overvalued at the present time.