

Fractal Patterns In The Stock Market


Fractals are patterns that repeat at different scales (physical or temporal). They appear in many natural systems such as coastlines, rivers and many plants including ferns.

Since the stock market is a system that arises from natural human behavior, fractals are part of its price history as well, and since human behavior is repetitive, fractals should help us to calculate the probabilities of future market moves.
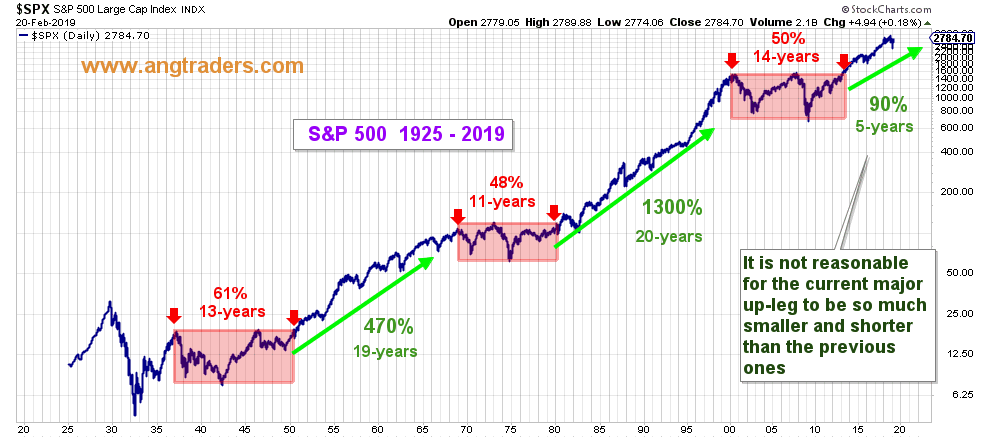
The chart below shows the S&P 500 (SPX) price history starting in 1925. This extra-long view allows us to discern some large-scale patterns. Specifically, three time-periods during which the SPX was range bound (pink area) and three intervening periods that produced major price increases (green arrows).
Speculation about the causes of these patterns can make for an interesting discussion, but they are irrelevant when it comes to assigning probabilities to future movements in price. Our hypothesis is that the patterns are a result of immutable human behavior and that this behavior (along with the resulting price patterns) is repetitive. Therefore, we do not need to know why the patterns exist, we only need to know how they exist (i.e. the timing of their existence) in order to make probabilistic predictions.
The range-trade sections are defined as starting at the initial high and ending when that high is surpassed (red pointer arrows on the chart above). The up-legs are defined as starting when the range-trade high is surpassed and ending at the high of the next range-trade (green arrows between the red pointers).
Notice that the period lengths of the range-trading sections are very similar; 13-, 11- and 14-years long. And that the two completed major up-legs (the current up-leg is still in progress), likewise, are of similar length; 19 and 20 years.
The variances within the range-trade patterns (the difference between the high and low of the range) as a percent of the range-high, also are quite similar: 61%, 48%, and 50%. The situation with the up-leg patterns, however, is very different. While the duration of both up-legs is essentially the same (19, 20-years), the size of the increase in price is very different — 1950–1969 produced a 470% increase, and 1980–2000 resulted in a 1300% increase.
The current up-leg, which started in 2014, is still in its infancy: Five-years-old with only a 90% increase. It’s unreasonable to expect that this major up-leg will be so different from the other two up-legs. It is reasonable to expect that the current up-leg will be of similar duration, which means it should last another 14-years.
This very long-term pattern, where periods of range trading are followed by periods of large price increases, also is found at shorter time scales. The chart below shows that the same patterns have formed over the past decade as during the past 90-years, range-trading, followed by significant up-legs — but forming over a much shorter time frame, which defines them as fractals.
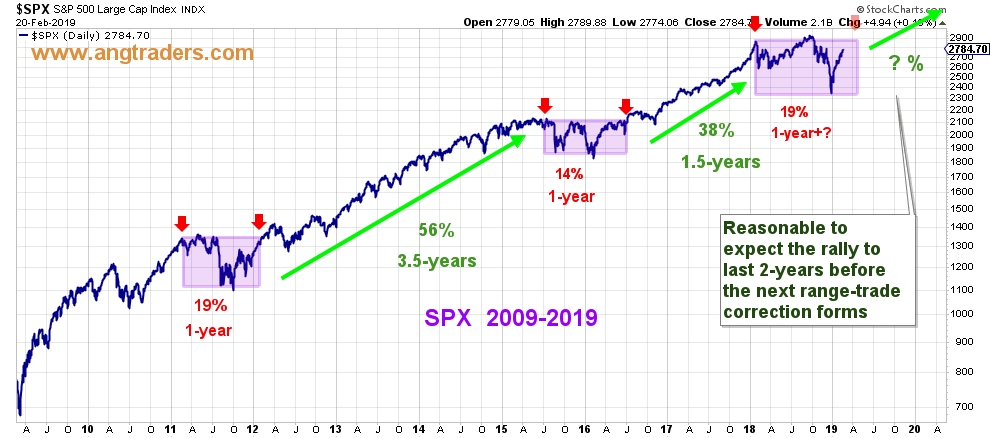
The range-trade periods are close to the same length (one year) and have similar variances (14%-19%), while the up-legs vary both in length and in magnitude — 3.5-years and 1.5-years in length and 56% and 38% in magnitude, respectively. We are close to breaking out of the recent corrective range trade and starting the next up-leg which will begin once we move above the range high of 2940. The past up-legs lasted between 1.5 and 3.5-years, therefore, it’s reasonable to expect that the next up-leg, once it starts, will last approximately two more years before correcting into another near-term range trade.
In conclusion, evidence from both the very long-term and the short-term fractal patterns supports our contention that the current bull market still has years of life left in it.
Join us at www.angtraders.com and replicate our trades and profits.
Fractal Patterns In The Stock Market was originally published in Data Driven Investor on Medium, where people are continuing the conversation by highlighting and responding to this story.
Quelle Nicholas Gomez