

Is it a Correction, or the Start of a Bear Market?


Without fail, bull markets accompany economic expansions. Also, without fail, both bull and bear markets experience corrections, and these corrections are of varying depths. Bear markets are the opposite of bull markets; the primary trend is up in bull markets and down in bear markets. Corrections, in both bull and bear markets, do not change the primary trend.
During the recent pullback, determining whether the primary-trend was broken or not became crucial. If the primary-trend was breached, then we would need to start closing long positions. But if it was not breached, then we would wait to ‘buy-the-dip’.
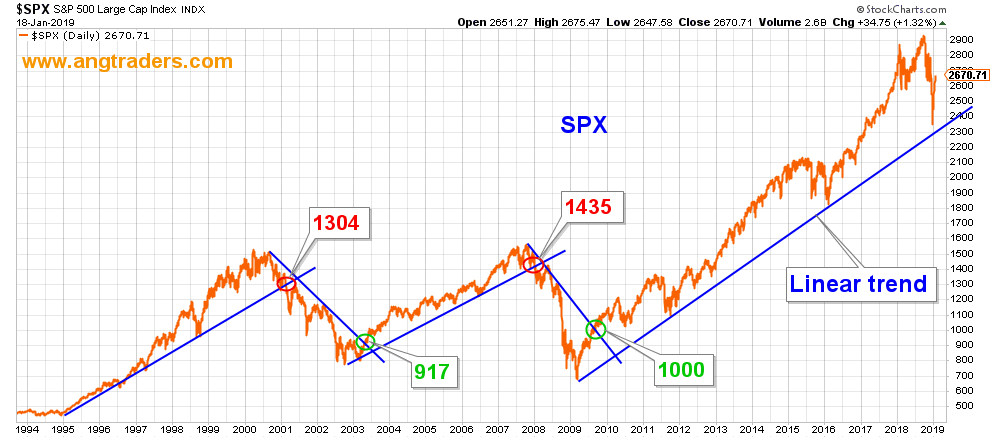
The primary-trend can be visualized either on a linear chart or on a logarithmic chart. In the former case, a simple straight line is drawn along the lows to determine the bull trend and along the highs for the bear trend (first chart below). When the SPX crosses the trend-line, the primary-trend is broken and a new trend is established.
On the log-scale chart, we use a Raff regression which produces upper and lower limits (chart below). In this case, a bull trend is broken if the extrapolation of the lower-limit line is breached (red dashed lines), and a bear trend is broken if the extrapolation of the upper-limit line is breached (green dashed lines).
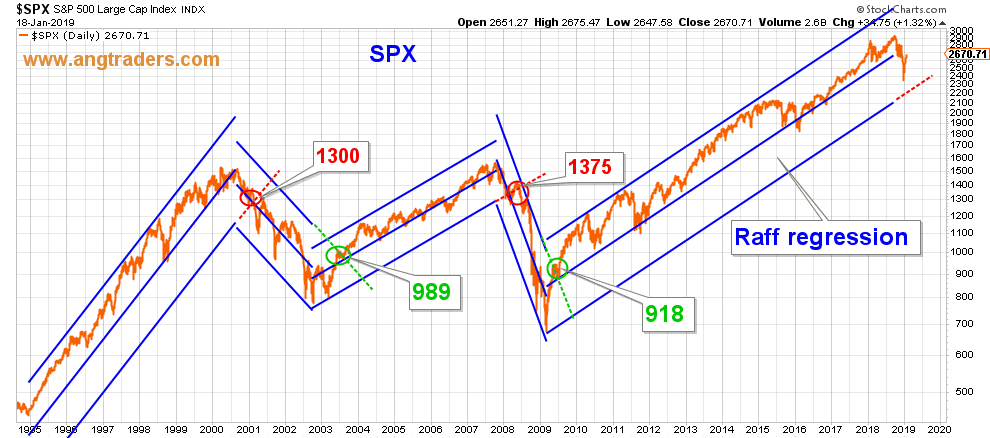
In both cases, the breach of the tech bubble happened at ~1300, but the breach of the housing bubble happened sooner on the linear chart (at 1435) than on the log chart (at 1375). The start of the housing bubble, also, was marked first on the linear chart (at 917), then on the log chart (at 989). But the start of the present bull market was market first on the log chart (at 918), then on the linear chart (at 1000).
The takeaway lesson here is that we monitor both types of charts and act on whichever chart signals the change in trend first. At the moment, the linear chart has a potential breach at ~2350, and the log chart has it at ~2300, which means the linear trend-line is closer to being breached. If it is breached (on a closing basis) we will start to close long positions. However, considering that the economy is still in its expansionary phase, we do not think a breach is likely. We have experienced a normal correction within the ongoing bull market.
ANG Traders
Join us at www.angtraders.com and replicate our trades and profits.
https://medium.com/media/0707f5c806284d01a4a13c7b13a91ce3/hrefIs it a Correction, or the Start of a Bear Market? was originally published in Data Driven Investor on Medium, where people are continuing the conversation by highlighting and responding to this story.
Quelle Nicholas Gomez