


Spreadsheet & Table updated weekly
Originally published December 20th, 2018 by Josh Arnold
Mega cap stocks are companies with market capitalizations in excess of $200 billion dollars.
The total number of mega cap stocks varies depending upon market conditions, but there are generally 25 to 30 in the US, so there are plenty to choose from for investors.
These are the largest stocks in the market today and tend to have recognizable brands, in addition to fairly steady revenue, earnings and dividend streams. Thus, mega cap stocks would tend to appeal to a wide variety of investors as they would typically see less volatility than smaller stocks and have more predictable forward returns.
This article includes a spreadsheet and table of all mega cap stocks, as well as detailed analysis on our Top 10 mega cap stocks today.
You can download a free spreadsheet of all 20+ mega cap stocks below for your records:
Click here to download your Mega Cap Stocks List Excel Spreadsheet now. Keep reading this article to learn more.
Additionally, you can see them in the table below:
| MSFT | Microsoft Corporation | 105.34 | 1.8 | 798,096.46 | 28.2 | 50.0 | 1.25 |
| AMZN | Amazon.com Inc. | 1,565.95 | 0.0 | 758,625.05 | 96.4 | 0.0 | 1.67 |
| AAPL | Apple Inc. | 167.08 | 1.8 | 788,068.25 | 15.1 | 26.6 | 1.18 |
| GOOGL | Alphabet Inc. | 1,067.46 | 0.0 | 725,656.18 | 24.0 | 0.0 | 1.04 |
| GOOG | Alphabet Inc. | 1,052.96 | 0.0 | 715,432.83 | 30.3 | 0.0 | 1.13 |
| FB | Facebook Inc. | 144.00 | 0.0 | 412,848.33 | 19.5 | 0.0 | 0.46 |
| JNJ | Johnson & Johnson | 129.96 | 2.8 | 349,783.57 | 16.3 | 45.1 | 0.72 |
| JPM | JP Morgan Chase & Co. | 99.33 | 3.2 | 327,685.97 | 11.3 | 36.8 | 1.16 |
| XOM | Exxon Mobil Corporation | 72.63 | 4.6 | 304,834.12 | 16.7 | 76.1 | 0.87 |
| V | Visa Inc. | 134.38 | 0.8 | 301,374.24 | 31.3 | 23.6 | 1.08 |
| WMT | Walmart Inc. | 91.72 | 2.3 | 264,611.09 | 20.9 | 47.8 | 0.40 |
| UNH | UnitedHealth Group Incorporated (DE) | 251.80 | 1.4 | 243,365.79 | 20.7 | 29.4 | 0.86 |
| PFE | Pfizer Inc. | 42.43 | 3.4 | 245,092.12 | 14.2 | 48.4 | 0.94 |
| VZ | Verizon Communications Inc. | 56.15 | 4.3 | 229,946.64 | 12.6 | 54.6 | 0.57 |
| BAC | Bank of America Corporation | 24.81 | 2.5 | 240,153.40 | 10.4 | 25.6 | 1.35 |
| PG | Procter & Gamble Company (The) | 92.40 | 3.1 | 230,430.36 | 22.4 | 69.4 | 0.38 |
| WFC | Wells Fargo & Company | 46.70 | 3.7 | 218,981.00 | 10.9 | 40.2 | 1.10 |
| CVX | Chevron Corporation | 110.39 | 4.1 | 209,688.38 | 16.9 | 69.1 | 1.12 |
| INTC | Intel Corporation | 47.46 | 2.5 | 217,885.36 | 10.8 | 27.2 | 0.85 |
| T | AT&T Inc. | 30.02 | 6.9 | 216,520.50 | 8.7 | 59.8 | 0.47 |
| CSCO | Cisco Systems Inc. | 44.29 | 3.0 | 198,092.07 | 19.4 | 58.2 | 1.15 |
| KO | Coca-Cola Company (The) | 48.00 | 3.2 | 205,674.75 | 23.4 | 75.6 | 0.60 |
| MA | Mastercard Incorporated | 193.71 | 0.7 | 212,473.28 | 31.9 | 21.9 | 1.14 |
| MRK | Merck & Company Inc. (new) | 74.41 | 3.0 | 193,285.99 | 17.4 | 51.5 | 0.73 |
| Ticker | Name | Price | Dividend Yield | Market Cap ($M) | P/E Ratio | Payout Ratio | Beta |
Keep reading to see the 10 best mega cap stocks analyzed in detail.
The 10 Best Mega Cap Stocks Today
Now that we’ve defined what a mega cap stock is, let’s take a look at the 10 best mega cap stocks, as defined by our Sure Analysis Research Database. The database ranks stocks’ total prospective annual returns, combining current yield, forecast earnings growth and any change in price from the valuation.
We’ve screened the mega cap stocks with the best prospective returns and have provided them below, ranked in reverse order of forecast total returns.
Mega Cap Stock #10: Verizon Communications
We’ll begin with Verizon Communications (VZ), the largest wireless service provider in the US. That segment makes up about three-quarters of its total revenue, so it is much more leveraged to wireless service performance than its main competitor, AT&T. The other quarter is derived from cable and broadband services, but Verizon is very much a wireless services company. Verizon’s market capitalization today is $236 billion and it enjoys $130 billion in annual revenue.
Verizon’s Q3 earnings report was released on 10/23/18 and results were generally strong. Revenue beat estimates, rising 2.8%, while earnings-per-share rose 24% from the year-ago period, also beating forecasts. Much of the gain in earnings-per-share was due to new revenue recognition principals as well as tax reform, but Verizon’s core results were still robust. The wireless business continues to power results as Verizon is seeing protracted weakness in its media and broadband/cable businesses, respectively.

Source: Q3 earnings presentation, page 9
Indeed, one can see the strength Verizon’s wireless business provides in the slide above from the earnings presentation. This segment makes up three-quarters of Verizon’s total revenue, so success here is critical. Wireless revenue grew 6.5% year-over-year and adjusted EBITDA grew 10%. We believe Verizon’s investments in 5G technology, which is due to hit the market in 2019, will continue to drive strong growth in its wireless segment. The other segments are certainly much weaker but given that the core business is performing as well as it is, we see continued earnings growth moving forward.
Importantly, Verizon’s dividend is well-covered by free cash flow. That number year-to-date is $14.2 billion on strong operating cash flows, while the dividend has consumed just over half of it at $7.3 billion. Verizon has a huge pile of debt in excess of $100 billion, but it has proven it can service that debt and even reduce it over time. While we’d prefer it if Verizon had less debt, it doesn’t appear to be an issue for profitability, liquidity or the dividend payment. You can see Verizon’s dividend safety analyzed in detail in the video below:
We have a fair value estimate of $61 for Verizon, implying a modest 1.3% annual tailwind to total returns. We also believe Verizon can produce 5% earnings growth annually, mostly due to growth in the wireless business. Finally, Verizon’s 4.2% current yield is certainly a draw for income investors given that yields that high can be difficult to come by. In total, we expect total annual returns in excess of 10% for Verizon in the years to come.
Mega Cap Stock #9: Exxon Mobil Corporation
Next up is Exxon Mobil Corporation (XOM), an end-to-end energy supermajor behemoth with a market capitalization of $320 billion. The company generates almost $300 billion in annual revenue, making it one of the largest firms in the world by that measure.
Exxon has gone to great lengths in recent years to diversify away from production of oil and gas and today, generates about one-fifth of its earnings from its chemicals segment, and about one-quarter of its earnings from the refining business.
Exxon reported Q3 earnings on 11/2/18 and earnings increased dramatically, rising from 93 cents in the year-ago quarter to $1.46 in this year’s Q3. The upstream segment performed very well as crude realizations were up a whopping 41% while natural gas realizations rose 30% against the weak period in last year’s Q3. Downstream earnings rose year-over-year as well, but mostly as a result of US tax reform. Yield and mix improved but more downtime and lower margins weighed on operating profits. The chemicals segment saw its earnings decline by about 30% year-over-year as improving realizations were more than offset by higher feed and energy costs. Still, earnings increased for the total company by 57% in Q3.

Source: Q3 earnings presentation, page 21
This slide shows some of the growth initiatives Exxon has in the pipeline that it is actually making tangible progress on today. The company is well-diversified in its revenue and earnings streams and continues to invest in all three businesses. In addition, in the core oil and gas business, the Permian and Bakken basins continue to provide sizable upside for volumes in the coming years. Exxon management believes the current rate of production from those areas can be more than doubled from today’s levels.
Exxon’s balance sheet is in terrific shape given the size of the company’s operations. Indeed, it only has $40 billion in debt on the balance sheet as of the end of the third quarter, which is only about one-fifth of its equity. Further, it is producing more cash than it needs to run the business and pay its dividend. In other words, it is producing surplus cash and slowly reducing debt. Free cash flow thus far in 2018 has come in at $16.5 billion, while the dividend costs less than $14 billion annually; Exxon has generated enough cash in three quarters to cover the entire year’s dividend. Given its sizable yield of 4.3%, covering the dividend will be very important for those holding the stock for income. You can see the company’s dividend safety analyzed in detail in the video below:
We believe Exxon’s current fair value to be only about $58, meaning it is significantly overvalued. That should result in a 5% headwind to total annual returns in the coming years, but will be more than offset by its growth potential. Indeed, we see earnings growth averaging 11.4% annually as Exxon continues to invest profitably for the future. Coupled with the 4.3% yield, we forecast 10.7% total annual returns going forward.
Mega Cap Stock #8: Chevron Corporation
Our next firm is Chevron Corporation (CVX), a company that is in many of the same businesses as Exxon Mobil. Interestingly, Chevron and Exxon Mobil are the only two energy sector Dividend Aristocrats. Chevron has a $217 billion market capitalization at present and, like Exxon, is much more diversified than it once was.
Chevron gets about 60% of its earnings from its upstream business while the remaining 40% comes from the downstream refining business. Chevron is still more leveraged to the price of oil than the other oil majors, and that can be a blessing during bull markets in oil, or a curse in bear markets.
Chevron reported Q3 earnings on 11/2/18 and results were strong. Revenue came in 22% higher from the year-ago period thanks to higher oil and gas prices as well as a sizable increase in production volumes. Oil-equivalent production rose to nearly 3 million barrels per day, a 9% increase from the third quarter last year. As a result, the upstream business saw earnings soar from less than $500 million to $3.4 billion year-over-year. The downstream business suffered due to significantly lower volumes, lower margins and lower asset sales against the year-ago period. However, it wasn’t enough to offset the strength of the upstream business as Chevron continues to grow its earnings.

Source: Investor presentation, page 13
We like Chevron for the future because of its sustainable portfolio of production assets. The company has a sensible strategy for maintaining reserves against its production levels, which means its asset base will be productive and profitable for a long time to come. Indeed, Chevron’s resource to production ratio is nearly 40 years, which is near the top of the oil and gas complex.
Like Exxon, Chevron’s debt is quite reasonable at one-fifth of equity and right at one time EBITDA. In addition, Chevron is producing significant free cash flow, a trait it certainly did not exhibit in 2016 and 2017. The company has produced almost $14 billion in free cash flow this year through three quarters, so we aren’t concerned about its ability to finance its expansion in the future or, critically, the dividend.
The dividend is currently worth 3.9% to shareholders, so it is quite strong compared to most large stocks. In addition, it costs Chevron less than $9 billion annually, so it is comfortably within its free cash flow production. This is another reason we like Chevron; the yield is near 4%, was recently raised, and is very well covered by free cash flow. You can see the company’s dividend safety analyzed in detail in the video below:
In total, we expect Chevron to produce annual shareholder returns in the coming years of 10.7%, just like Exxon. The mix will be different, however, as Chevron should grow earnings at 5.4% while the valuation contributes 1.4%. Coupled with the 3.9% yield, Chevron looks attractive to prospective shareholders, and much more so than it did in 2016 or 2017.
Mega Cap Stock #7: Wells Fargo
Next up is Wells Fargo (WFC), a giant in the banking industry with nearly $2 trillion in assets. Wells Fargo has been around since 1852 and today, has more than 250,000 employees in over 40 countries. It is still heavy in branch operations, boasting more than 8,000 total locations, which help its customers with core banking activities, investments, mortgages and commercial lending. Wells Fargo’s current market capitalization is $219 billion after a steep recent selloff.
Wells Fargo reported Q3 earnings on 10/12/18 and results were quite strong. Adjusted earnings-per-share rose 40% against the year-ago period and 18% against this year’s Q2. Higher originations in auto, small business, home equity and personal loans helped to drive the top line and earnings higher. Wells Fargo has a regulator-imposed asset cap, but that doesn’t seem to be hurting its growth at the moment. Charge-off rates remain very low and return on equity was robust in Q3 at 12%. Cost-cutting activities continue as well, helping to drive the bank’s efficiency ratio lower, boosting margins.

Source: Investor presentation, page 3
We like Wells Fargo’s growth potential – its asset cap notwithstanding – because it is making great progress on a number of growth initiatives. This slide from the company’s Q3 investor presentation shows some of the initiatives that are helping to fuel the bank’s growth without the benefit of being able to expand its asset base. The bank is moving more heavily into the credit card business, which typically hasn’t been a source of strength as it has concentrated on more traditional lending in the past. Home equity continues to be a big driver of growth as originations rose 16% in Q3, while auto originations rose 10% and small business originations increased 28%. Wells Fargo isn’t standing by and letting its asset cap get in the way, and we think the bank has more growth in front of it.
Wells Fargo is currently yielding 3.6%, so it is certainly strong among the financials. The bank’s payout ratio is around 40%, so the dividend certainly is safe and will continue to grow for the foreseeable future. That makes Wells Fargo a strong pick for those seeking income and dividend growth.
We see fair value as $51 for Wells Fargo, and it is trading moderately under that today. Therefore, we forecast a small tailwind to total returns from a higher valuation as the stock rises over time.
Overall, we expect Wells Fargo to produce 11.8% total returns annually in the coming years. We see these returns accruing from the 3.6% yield, 6% earnings growth and a 2.2% return from a higher valuation. Wells Fargo, then, looks attractive to investors seeking current income, moderate growth and a reasonable valuation.
Mega Cap Stock #6: Visa, Inc.
The next stock in our list is Visa Inc. (V), the international payments industry juggernaut that has activity in more than 200 countries around the globe. The company is active in all sorts of digital payment methods and today, produces $23 billion in revenue and has a market capitalization of $298 billion.
The company reported Q4 earnings on 10/24/18 and results were very strong. Adjusted earnings-per-share soared 34% against the year-ago period, capping a year where that metric rose 32%. Revenue was up 12% in Q4 and for the full-year as payment volume continues to drive the top line higher. Visa is well-positioned to take full advantage of the seemingly unstoppable trend of more digital payments in favor of legacy methods like cash and checks, as recent results show. Management guided for mid-teens earnings growth for the new fiscal year, continuing a streak of very impressive rates of growth. Visa continues to deploy cash to shareholders via dividends and buybacks, with the former being increased by 19% recently to $1.00 per share annually. In total, shareholder distributions were $2.1 billion in Q4 alone.

Source: Q4 earnings presentation, page 9
We like Visa for the long-term because the company’s leverage to digital payments is strong. This chart of year-over-year revenue detail from Q4 shows what the past several years have looked like for the payments giant. This has been driven mostly by transaction volume growth, which continues to surge worldwide. In addition, Visa’s operating costs are largely fixed, so over time, margins improve as revenue rises. There is one note of caution for fiscal 2019, however, as management cautioned client incentives would rise to 22% to 23% of revenue from the current 21.7%. This may crimp margins if it comes in on the high end of guidance, but this does not detract from the long-term story.
Visa’s financial position is excellent as it has cash and equivalents of nearly $16 billion on the balance sheet in addition to ~$12 billion in annual free cash flow generation. Visa’s capital expenditures are less than $1 billion annually, so the vast majority of the cash it generates is unrestricted. We suspect Visa will buy back shares by the billions of dollars each year for a long time to come, in addition to boosting its dividend at high rates. The current yield is only 0.7%, so it certainly isn’t an income stock. But given the company’s free cash flow rates, we expect the dividend will move much higher in the years to come.
Overall, we expect total annual returns for Visa of 11.8%, consisting of the 0.7% yield, 13% earnings growth and a modest 1.9% headwind from the valuation that should tick lower over time. Thus, Visa is appropriate for those investors seeking high rates of growth at a reasonable price, but would certainly not work for income investors.
Mega Cap Stock #5: Alphabet Inc.
Next up is Alphabet Inc. (GOOGL)/(GOOG), parent company of the search behemoth Google. The company went public in 2004 and since that time, it has grown into the dominant player in search worldwide, as well as one of the largest companies by market capitalization, which is currently $710 billion. Alphabet competes in what could be called Google’s legacy businesses, namely the core search business, Android, Chrome, YouTube, etc.
Alphabet reported Q3 earnings on 10/25/18 and results were somewhat mixed. Revenue rose 22% in constant currency from the year-ago period thanks to a 20% surge in advertising revenue, but still fell short of expectations. Earnings-per-share increased 36%, beating expectations thanks mostly to higher revenue, a much lower tax rate, and share repurchases. In addition, free cash flow increased to $7.9 billion in Q3 from $6.3 billion in last year’s Q3.

Source: Q3 earnings release, page 1
This chart from the Q3 earnings release shows Alphabet’s immense revenue growth, but also its meaningful decline in operating margins in Q3. Indeed, operating margin fell from 28% to 25% year-over-year, and while that is certainly a very strong level of operating earnings, it is also a significant decline against last year. Alphabet has been hiring at a rapid rate, employing 21% more people in this year’s Q3 than the comparable period last year. However, we see the weakness as temporary as the company is investing in the next phase of growth. Alphabet has proven adept at investing in the right places in the past and we believe that will continue to be the case moving forward.
Alphabet doesn’t pay a dividend and we don’t expect that will change at any point in the foreseeable future. The company has enormous amounts of free cash flow but is choosing to invest for future growth and buy back shares.
Alphabet’s balance sheet is also pristine as it has taken on what amounts to a token amount of debt in the past few years. Its clean books and sizable free cash flow mean that financing isn’t a concern today and won’t be in the years to come.
In total, we see Alphabet as producing 12.7% total returns annually in the coming years. We forecast 15% annual earnings growth thanks to continued strength in the core advertising business, no impact from a dividend payment and a modest 2.3% headwind from the valuation. We see Alphabet as trading at 112% of fair value today, so it isn’t cheap. However, the company’s track record and outlook for growth are superb, so we think its growth is enough to offset a slightly higher valuation.
Mega Cap Stock #4: Intel Corp.
Our next mega cap stock is Intel Corp. (INTC), the dividend paying technology giant that competes in various computing-related fields, including the manufacture and design of laptops, tablets, as well as storage and data products. The company produces more than $70 billion in annual revenue and has a current market capitalization of $215 billion.
Intel reported Q3 earnings on 10/25/18 and results were a record, with a guidance boost to boot. Revenue was up 19% year-over-year to a record $19.2 billion thanks to a 22% gain in data-centric revenue while PC-centric revenue was up 16%. Earnings-per-share came in at a record as well, adding 47% against the comparable period last year to $1.38. In addition, Intel has reported year-to-date free cash flow of $11.2 billion and has returned $4.2 billion to shareholders via dividends and another $8.5 billion in share repurchases. Finally, management boosted their full-year earnings-per-share guidance by ~$0.40 for the full year.

Source: Q3 earnings slides, page 13
Intel’s new guidance for the year highlights the company’s growth potential moving forward. Data-centric revenue continues to carry more than its fair share of the weight in terms of revenue growth, something we believe will continue. Intel realized years ago that big data and the ability to transmit and process would be critical in the future. It invested accordingly, and those investments are certainly paying off handsomely today with forecast 20% revenue growth from its data businesses combined. Intel is also still focused on boosting operating margins via prudent expense management. It is spending less of its revenue on capital expenditures and more on research and development in order to build future growth. The formula is certainly working and we believe this will help Intel produce 7% earnings growth annually in the coming years.
Intel has a very reasonable amount of debt and its interest coverage is superb, so there are certainly no financing concerns to speak of. In addition, it produces north of $15 billion annually in free cash flow, affording it the ability to pay its ample dividend, which is currently yielding 2.5%, and repurchase billions of dollars of stock each year.
Overall, we see Intel as producing 13.7% total annual returns moving forward, consisting of the 2.5% yield, 7% earnings growth and a 4.2% tailwind from the valuation. Intel trades for about 80% of fair value, meaning we see the stock as having strong growth prospects as well as an attractive valuation.
Mega Cap Stock #3: Apple Inc.
Our next mega cap company is Apple Inc. (AAPL), one of the largest companies in the world in terms of market capitalization, which stands at $778 billion. The company designs, manufactures and markets various mobile devices including phones and tablets, as well as laptops. In addition, its once-small services business is now a meaningful portion of total revenue and earnings as the company has spent years building out a recurring revenue model to supplement its device revenue.
Apple reported Q4 earnings on 11/1/18 and results were characteristically strong. Revenue was up 20% to a new Q4 record of $62.9 billion. Services revenue reached a record $10 billion during the quarter, an increase of 27% year-over-year. In addition, strength was seen in wearables, phones and laptops as well as the company continues to fire on all cylinders. Earnings-per-share rose 41% year-over-year thanks to strong revenue growth as well as some operating leverage from lower SG&A costs.
In addition, the dividend is 16% higher than it was in last year’s Q4 while the share count is more than 6% lower; Apple’s shareholder returns continue to grow as it produces far more cash than it needs to run the business.
We see 8% earnings growth accruing annually for Apple in the years to come as it continues to boost its services revenue, which should also help increase margins further. Device revenue will continue to move higher, although at slower rates than the services business. We also see a meaningful tailwind from share repurchases, and investors will continue to enjoy dividend increases for many years to come given the company’s strong free cash flow.
In total, we expect 15% annual returns accruing from the 1.8% dividend yield, 8% earnings growth and a 5.3% tailwind from a rising valuation. Indeed, we see Apple as trading at just 77% of fair value, meaning the stock offers investors a unique blend of growth and value today.
Mega Cap Stock #2: Bank of America
The penultimate company on our list is Bank of America (BAC), the banking giant that has undergone a huge transformation since the financial crisis. Bank of America competes in just about every business a financial company can, including lending, deposit-taking, investment banking, credit cards, and commercial banking. The bank has just over $90 billion in annual revenue and a $240 billion market capitalization.
Bank of America reported Q3 earnings on 10/15/18 and results were robust as the bank saw a sizable increase in earnings for each of its major reporting segments. Consumer banking saw net income rise 49% year-over-year as loans rose 6% and the Merrill Edge business saw its brokerage assets rise 22%. Global wealth management’s net income increased 31% as higher loan and client balances contributed to higher operating margins. Global banking saw its net income rise 13% as most of the gains accrued from a lower efficiency ratio, which came in at just 45%. Finally, global markets’ net income rose 21% mainly on strength in equities trading revenue. In total, diluted earnings-per-share increased 43% to $0.66 in Q3.
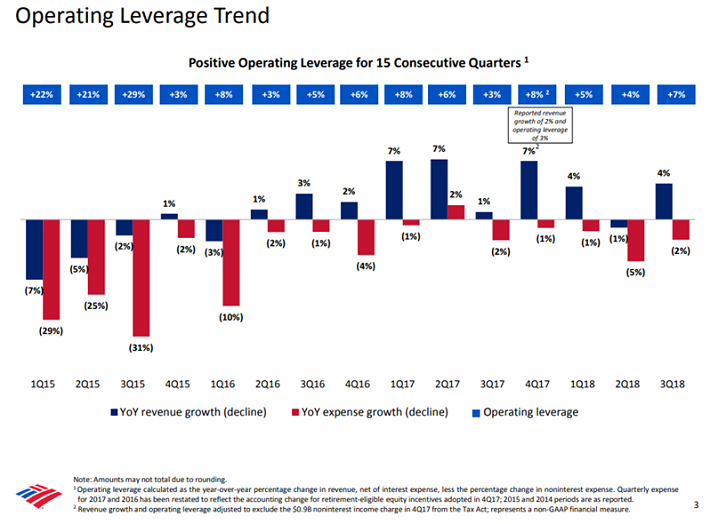
Source: Q3 earnings slides, page 3
While Bank of America is doing a terrific job of growing revenue in all of its segments, we think its growth looks better than its peer group because of operating leverage. This slide from the Q3 earnings release shows Bank of America’s operating leverage for the past fifteen quarters, and every single one of them shows a gain. In other words, expenses have fallen as a percentage of revenue year-over-year every quarter for nearly four years. That sort of expense management comes in handy not only during good times, but during the inevitable downturn as well. We think Bank of America’s intense focus on cost savings will continue to boost earnings growth for years to come, which we forecast will be 8.2% annually.
The bank’s 2.5% dividend yield is safe and growing and given that it consumes just one-quarter of earnings, it is very safe. We certainly see no issues in terms of Bank of America needing to cut its dividend anytime soon, as it did during the crisis. It is much stronger in terms of capital buffers than it was prior to the crisis so we believe the dividend is very safe, even during a recession.
Overall, we see Bank of America as producing 17.3% total returns in the years to come. It is trading for just 72% of our fair value estimate, meaning it should see a 6.6% annual tailwind from a rising valuation, in addition to the 2.5% current yield and 8.2% earnings growth. We therefore see Bank of America as the strongest pick among the mega banks for prospective returns as it offers yield, growth and value.
Mega Cap Stock #1: AT&T Inc.
The final company in our list is AT&T Inc. (T), the telecommunications giant. The company is a leading provider of digital entertainment services and communications internationally. AT&T offers internet, television and wireless access and enjoys $170 billion in annual revenue. Today, the stock has a market capitalization of $216 billion, making it one of the smaller stocks in our list.
AT&T reported Q3 earnings on 10/24/18 and the release drove the stock down. AT&T, however, looked good on several of its operating metrics. Revenue increased 15% as Time Warner’s strength was partially offset by weakness in Latin America. Adjusted earnings-per-share rose 22% to $0.90 as the legacy business – ex-Time Warner – saw improved profitability. Adjusted operating margin rose 310bps thanks to prudent expense management, and free cash flow soared 16%. We saw the report as a good one, notwithstanding the reaction from investors.

Source: Q3 earnings slides, page 5
While the legacy business has a lot of positives – not the least of which is billions of dollars of free cash flow annually – AT&T’s future growth, in our view, hinges upon Time Warner. This slide from the earnings presentation shows the strong numbers the recently-acquired company put up in Q3, its first full quarter under the AT&T umbrella. Revenue was up 7% on higher subscription and licensing revenues, while operating margins rose to 31.1%, highlighting the immense profitability the business provides to AT&T. The content library from Time Warner is outstanding, including the HBO business that has nearly 40% operating margins, and the Turner TV business with nearly 50% operating margins. We like the acquisition from AT&T’s perspective as it boosts the company’s margin profile and provides another avenue for future growth, which we estimate at 6% annually.
AT&T does have a prodigious debt load with ~$170 billion in long-term debt and another $65 billion in short-term liabilities. However, interest expense is less than 30% of operating earnings, so we don’t see any problems with the company’s assets producing enough earnings to cover interest in the future. In addition, free cash flow has amounted to $14.8 billion so far this year against dividend payments of $9.8 billion. That means the stock’s 6.8% yield is very safe, which is key to income investors that depend upon it. You can learn more about the company’s dividend safety in the video below:
Overall, we expect total annual returns to crest 20% for AT&T, consisting of the 6.8% yield, 6% earnings growth and a 9.2% gain from a higher valuation. AT&T trades for just 63% of our fair value estimate of $47, implying significant upside for patient investors. With its current mix of growth catalysts, deep value and a very high yield, AT&T is the most attractive mega cap stock in our coverage universe.
Final Thoughts
Mega cap stocks offer investors access to the largest and generally most profitable companies in the world. The group tends to hold up better during downturns and offer investors steady streams of revenue and earnings.
Many of the stocks on this list offer investors generous dividend yields as well, but all of them have high prospective total returns. These 10 stocks, we believe, collectively offer investors an attractive blend of growth, value and yield.