

Market Similarities Continue to Form


It is well understood that no two markets are ever alike. Less well understood is the fact that all markets have similarities, and that some markets are more similar than others. The ‘Tech rally’ at the end of the last century and today’s decade-long ‘Central Bank rally’, have much in common, both at the gross-scale and the fine-scale. The chart below, shows the similarities that the two markets have with each other and with the US dollar index.

At a shorter time scale, we have been watching C3 (correction 3) from 2000 being replicated again today (charts below).


At an even finer scale, the similarities are still striking (charts below).


Notice, in the two charts above, how the sentiment increased its bullish stance (increased bull sentiment and decreased bear sentiment) in both 2000 and 2018. If the pattern continues to replicate, we can expect a rally (R4) to new highs.
All markets have the same three stages; early, middle, and late. We are arguing that, although we are in the late stage of this bull market, we have not reached the end, just yet.
Sentiment
The AAII investor survey was little changed this week; bull sentiment -0.9%, bear sentiment -3.9%, neutral +4.5%. Long-term, we think the bottom is in for this correction (chart below).

{This section is for paid subscribers only}
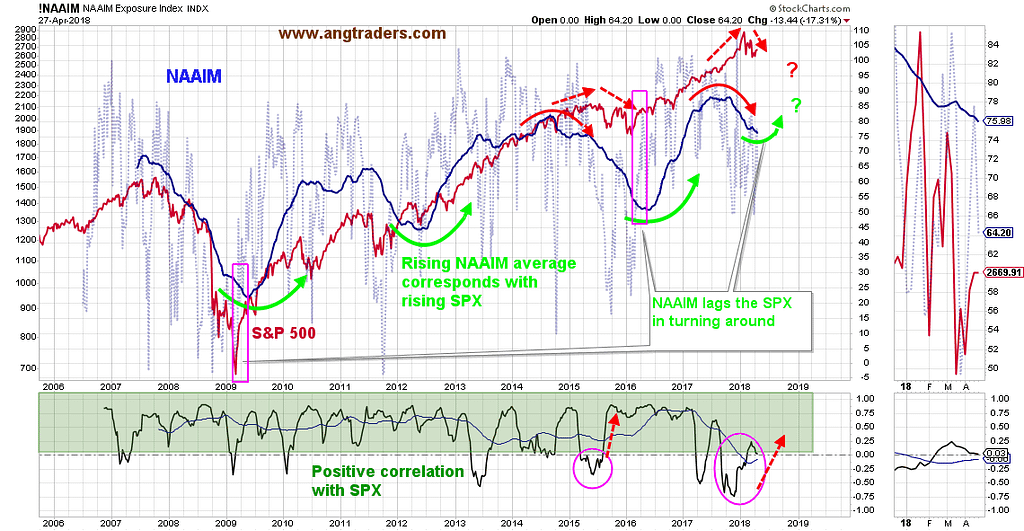
The NAAIM index continues to move lower, but as the pink rectangles on the chart below highlight, the NAAIM index lags behind the SPX after a correction, so we continue to assume that the bottom is in for this correction (chart below).
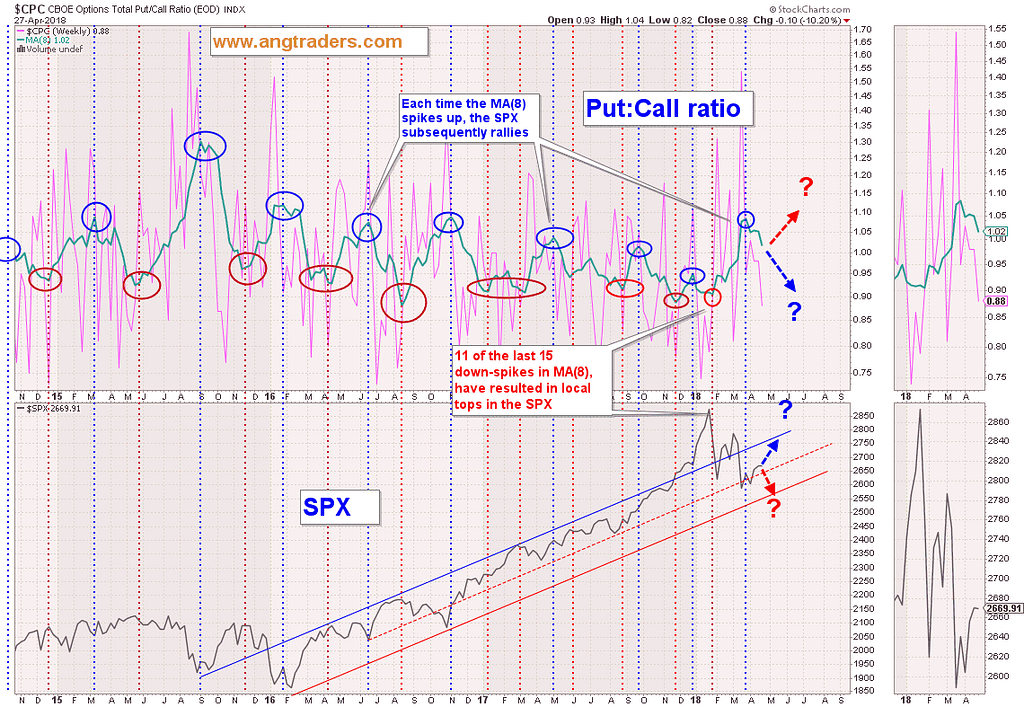
The put-to-call ratio continues to follow an up-spike pattern which always signals an SPX rally (chart below).
{This section is for paid subscribers only}
Fundamentals
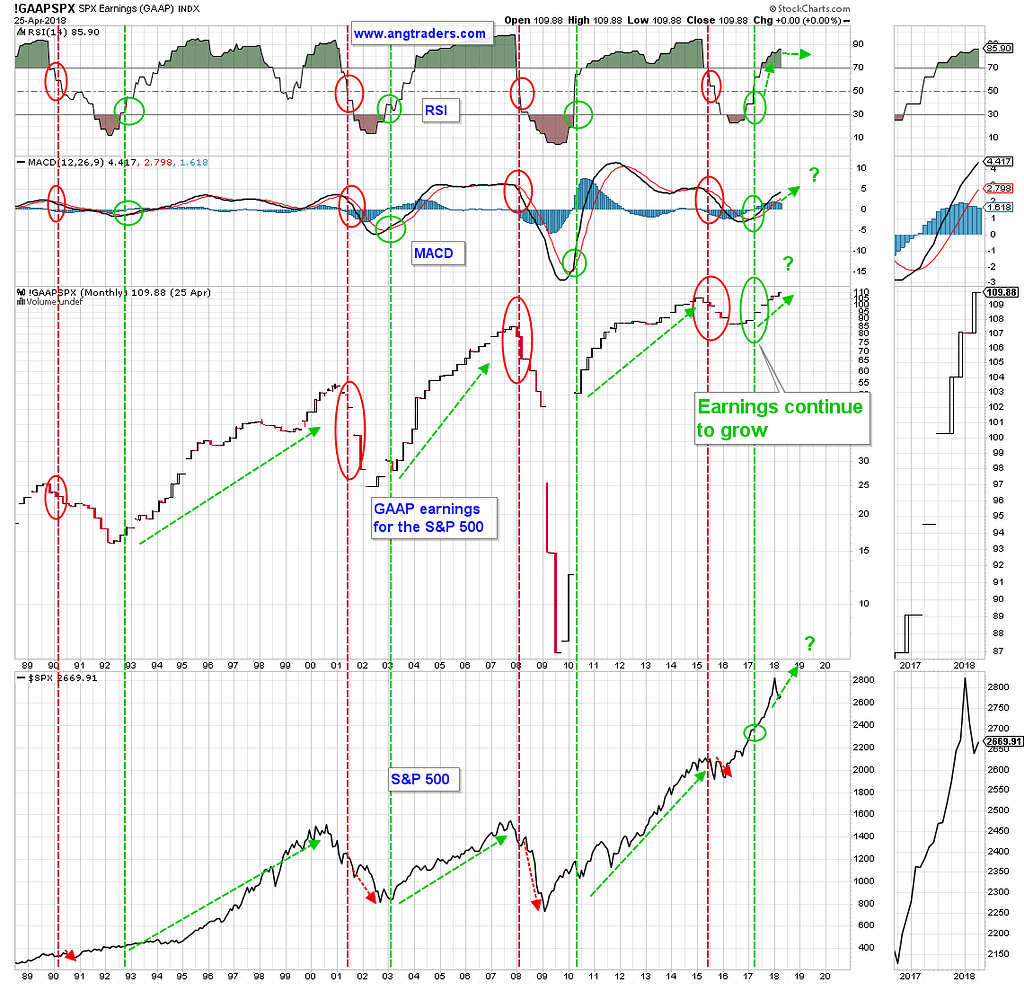
The GAAP earnings continue to rise (seven quarters in a row).
Technical
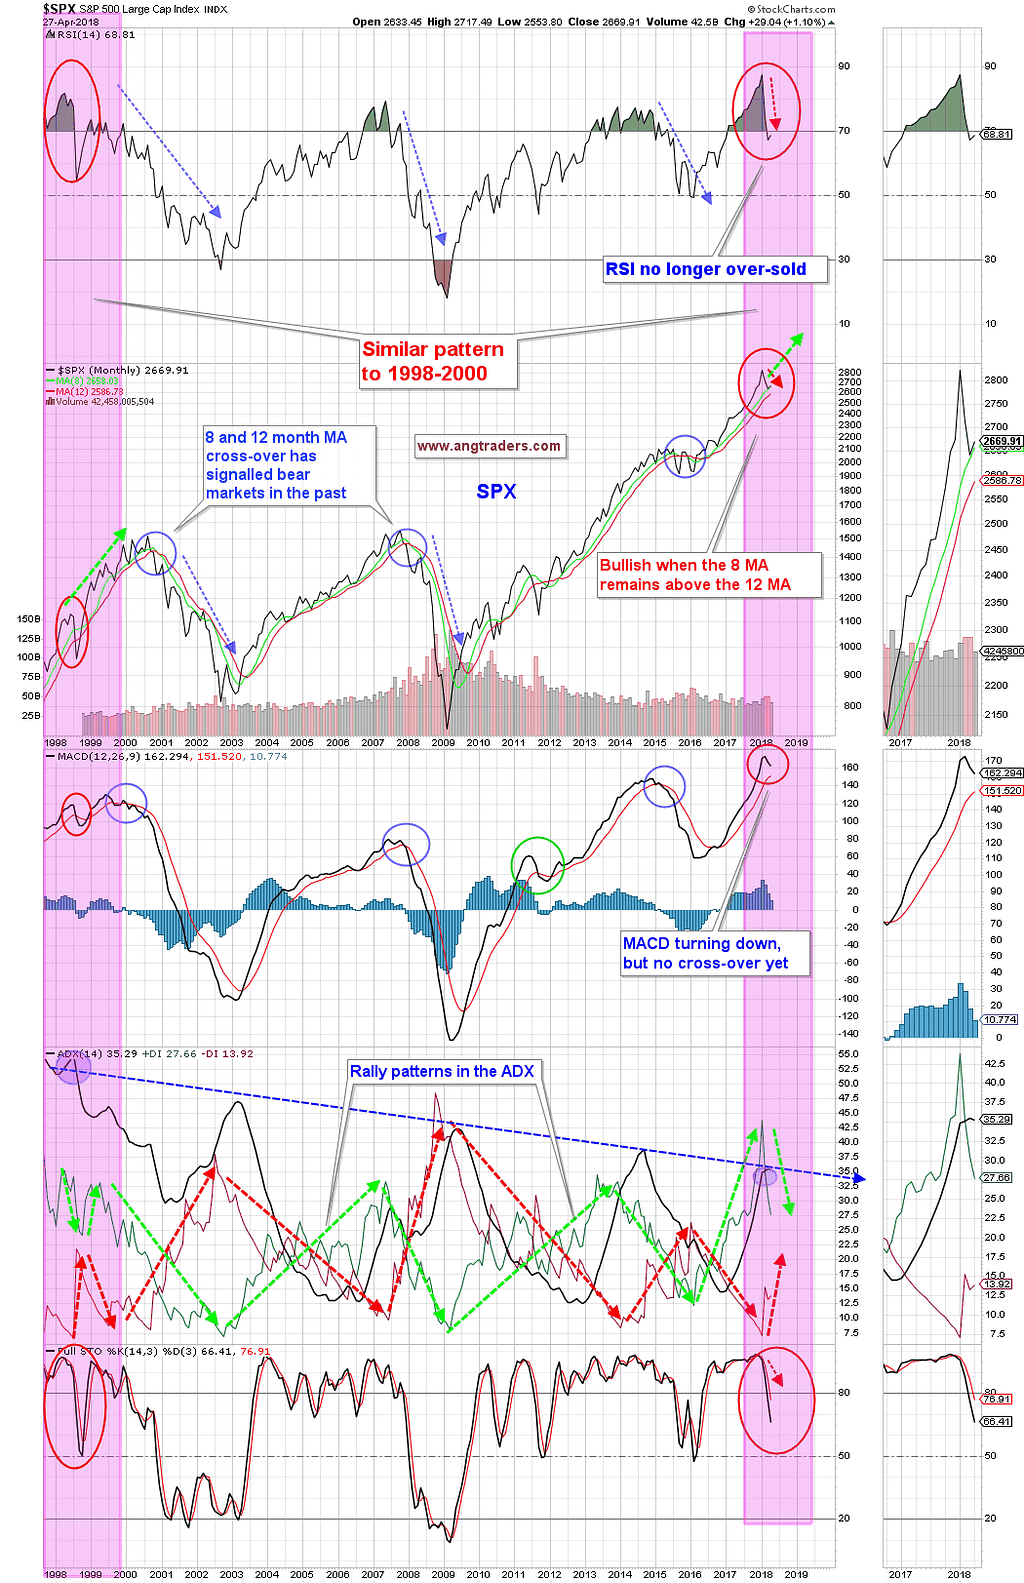
Long-term, the technical picture is improving; the SPX has bounced off the 8-month moving average, the MACD has still not made a bear cross-over, and overall, the technical situation is similar to 1998–2000 (chart below).
{This section is for paid subscribers only}
Oil
{This section is for paid subscribers only}
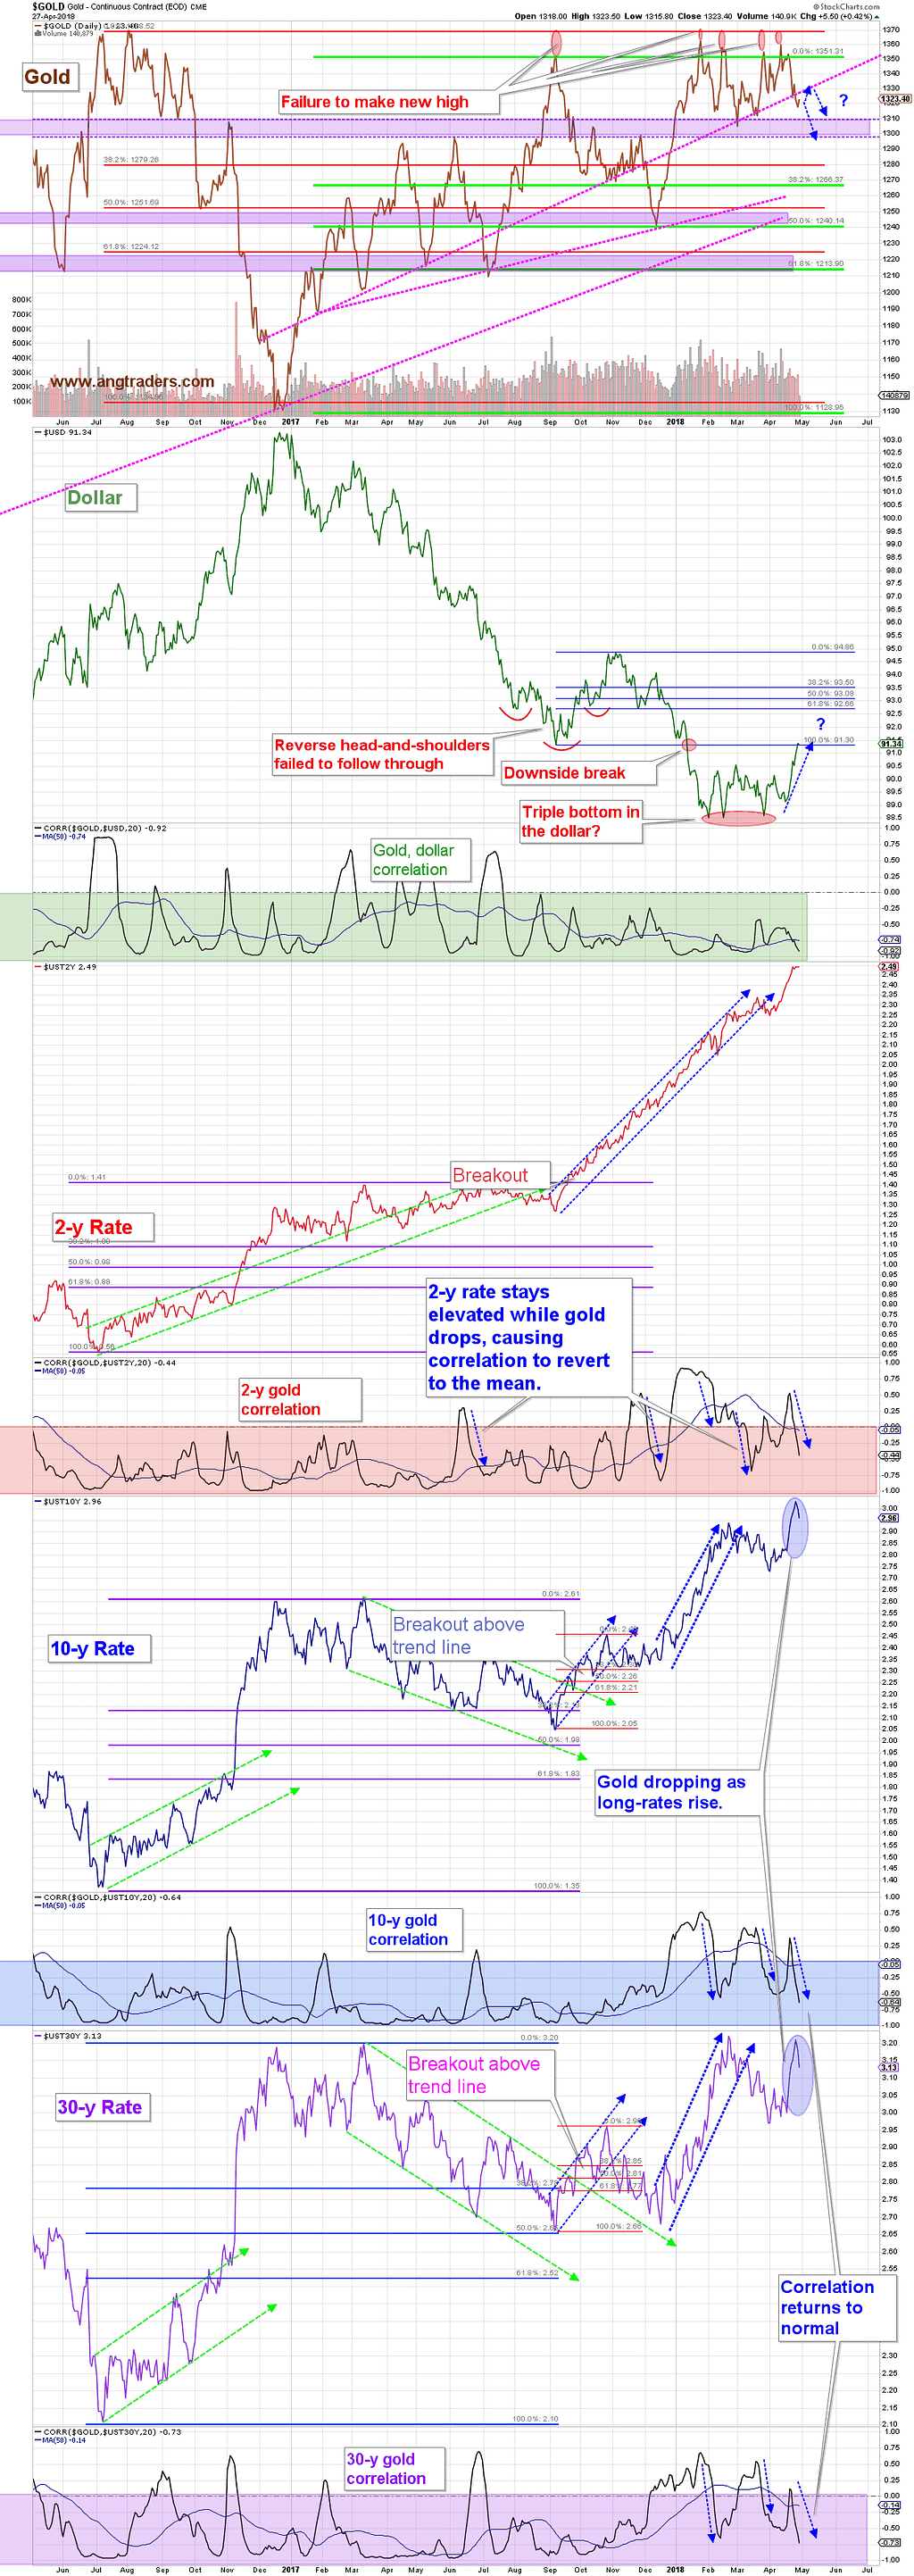
Gold
Gold has fallen as the dollar has rallied, and gold has returned to a negative correlation with rates. The dollar has rallied to resistance at 91.30, and if it continues to rally from here, gold will continue to weaken down to $1310-$1300 support. Until the $1300 support is broken, gold can still rally within its recent price range (chart below).
{This section is for paid subscribers only}
We wish our subscribers a profitable week ahead and ask that email be monitored for Trade Alerts.
Regards,
ANG Traders
Join us at www.angtraders.com and replicate our trades and profits.
Source: Nicholas Gomez