


Updated on March 12th, 2019 by Josh Arnold
Oil prices have rebounded in recent months, but on the whole, the past few years haven’t been kind to “black gold”. This poses a problem for companies that engage in the production or transportation of oil, along with a variety of other industries that feel the impact.
Vermilion Energy (VET), along with many of its competitors, have much lower share prices than they have in recent years because of this.
While this might seem like a negative event on the surface, lower stock prices create higher dividend yields – and buying opportunities for opportunistic investors.
Vermilion’s massive 8.2% dividend yield makes it a member of the short list of stocks with 5%+ dividend yields. You can see the full list of 5%+ dividend yields here.
Better yet, Vermilion Energy actually pays monthly dividends. Monthly dividends are ideal for some investors because they create a more stable income stream for those looking to generate portfolio income.
There are currently just 39 monthly dividend stocks. You can download the full list of monthly dividend stocks from our database below:
Vermilion Energy’s high dividend yield and monthly dividend payments make it stand out to dividend investors. This article will analyze the investment prospects of Vermilion Energy in detail.
Business Overview
Vermilion Energy is an international oil and gas production company with a global operational footprint.
Note that Vermilion trades in both Toronto and New York, and that we will use the Canadian listing in this article. Thus, all financials are in Canadian dollars, unless otherwise noted.
Founded in 1994, Vermilion Energy is headquartered in Calgary, Alberta, Canada and has a market capitalization of $5.2 billion.
More details about Vermilion Energy’s business model can be seen below.

Source: Vermilion Energy March 2019 Investor Presentation, slide 2
Since the company’s founding in 1994, Vermilion has experienced a truly exceptional rate of growth.
It executed its initial public offering in April 1994 with an adjusted opening stock price of $0.30 per share. Currently, Vermilion is trading at a stock price of ~$34, which means that investors that have held since the IPO are holding a 100-bagger with the added bonus of an 8%+ current dividend yield.
The company has reinvented itself a few times since its corporate inception.
In 2003, Vermilion Energy changed its corporate structure to that of a Canadian income trust, then converted back to a corporation in 2010. In 2013, Vermilion Energy was listed on the New York Stock Exchange, giving it exposure to a new group of United States-based investors.

Source: Vermilion Energy March 2019 Investor Presentation, slide 5
The company’s growth since its founding is nothing short of remarkable. With that said, Vermilion Energy still has a strong growth runway.
The company is driving growth through an attractive mix of organic expansion and mergers & acquisitions. Vermilion has a deep and diversified project backlog, allowing the company to pursue scale without sacrificing simplicity. It also isn’t afraid to go out and make bold purchases, as it did with Spartan Energy in 2018.
Vermilion Energy also benefits from a considerable amount of geographic diversification.
Along with its core operations in the United States, Vermilion Energy has a meaningful presence in Europe and Australia, giving it exposure to three core operating geographies.

Source: Vermilion Energy March 2019 Investor Presentation, slide 4
In fact, Vermilion expects to get 38% of its total production this year from outside North America, about half of its funds-from-operations, or FFO, and 60% of its free cash flow.
Vermilion’s diversification is focused on stable parts of the world where geopolitical risks are essentially nonexistent, helping to cement the relative safety of its model.
The publicly-traded parent company acts as a holding company for three operating subsidiaries in Vermilion’s main geographies: Europe, North America, and Australia.
At the headquarters level, staff focus on making capital allocation decisions while the operating business units are responsible for executing on their designated growth projects and delivering production, capex, and opex targets.
The company’s corporate structure can be seen in more detail below.

Source: Vermilion Energy March 2019 Investor Presentation, slide 34
We’ll now take a look at Vermilion Energy’s growth prospects in detail.
Growth Prospects
Vermilion Energy’s total returns have been extremely strong since the company’s inception in 1994.
The company’s main yardstick by which it measures performance is fund flows from operations (FFO), a non-GAAP financial measure calculated by adding back non-cash charges like depreciation and amortization to net income.
After the collapse in oil prices in 2014, Vermilion, and just about any other company it competes with, suffered sizable earnings capacity declines. FFO fell from nearly $8 in 2014 to just over $4 in 2016, but has since recovered nicely.
Vermilion Energy has achieved double-digit percentage FFO growth in many of the past years, as seen below:

Source: Vermilion Energy March 2019 Investor Presentation, slide 13
Along with strong profit growth (as measured by fund flows from operations), Vermilion’s business generates a substantial amount of cash flow. Free cash flow was negative in 2010 and 2011, but has since been positive every year.
Since 2016, Vermilion has seen FCF-per-share in excess of $2, which easily covers the stock’s dividend.

Source: Vermilion Energy March 2019 Investor Presentation, slide 8
Looking ahead, Vermilion’s exposure to multiple geographies and the company’s strong cash flow generation will drive its growth, as these factors combined allow Vermilion to be selectively opportunistic in the hunt for additional high-quality oil & gas assets.
As we can see above, Vermilion’s history of growth is quite impressive. Production growth has averaged 15% annually since 2012 and this year certainly isn’t showing any signs of slowing.
Vermilion’s growth still has some runway, and that it should be able to produce low-single digit FFO growth annually in the years to come.
Competitive Advantages & Recession Performance
Like many energy companies, Vermilion Energy’s competitive advantage comes from its asset base.
The company also benefits tremendously from its fantastic level of geographic diversification. This exposes Vermilion Energy to additional oil-rich regions while simultaneously isolating the company from any regional economic downturns or natural disasters.
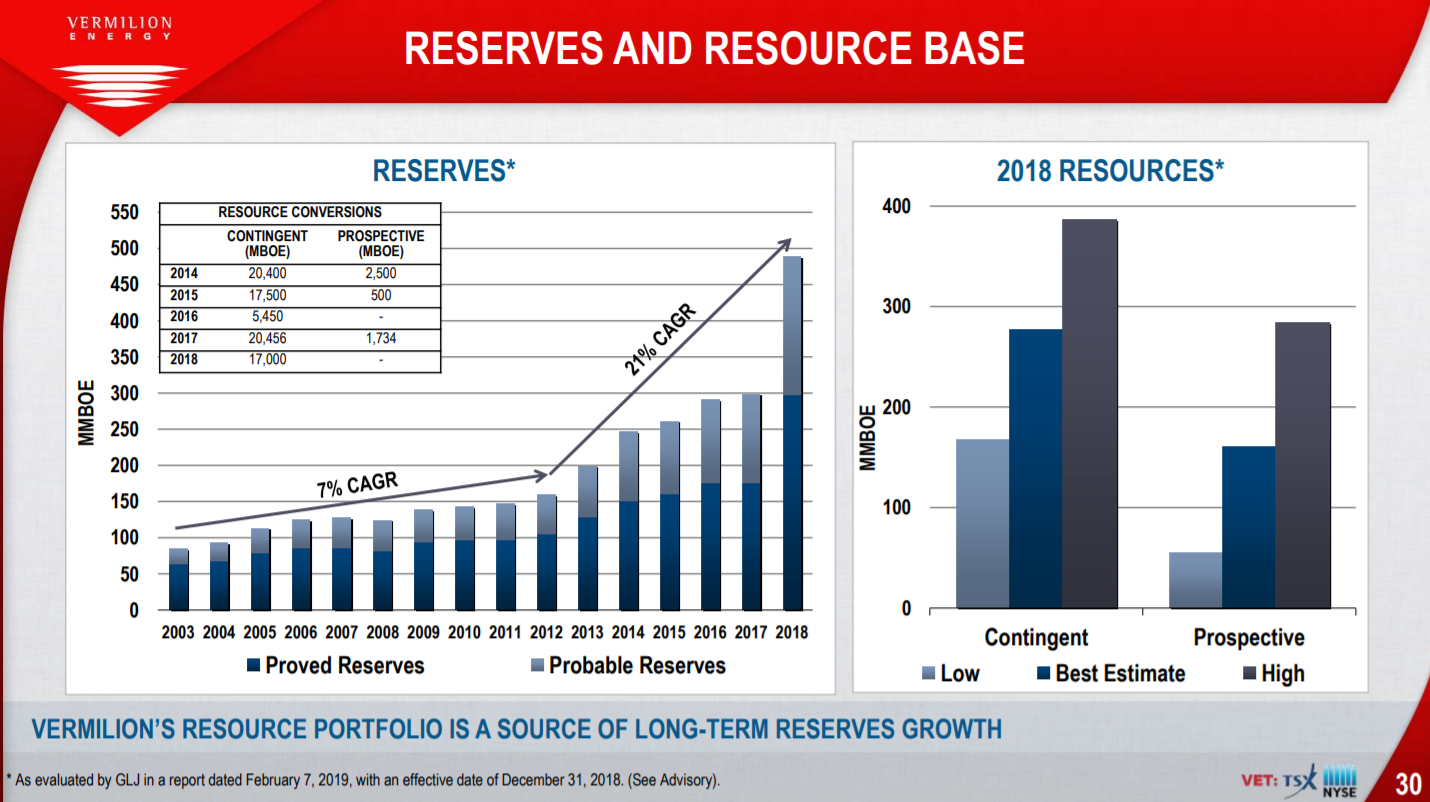
Source: Vermilion Energy March 2019 Investor Presentation, slide 30
The company’s proven reserves have skyrocketed in recent years and we see this as a major advantage for the company’s long-term stability against its competitors.
Investors can also appreciate the company’s diversification not only from a geographical perspective, but in its commodity mix as well.
Vermilion is extremely well diversified between oil products and gas. This is something that many pure-play oil or gas companies do not possess.
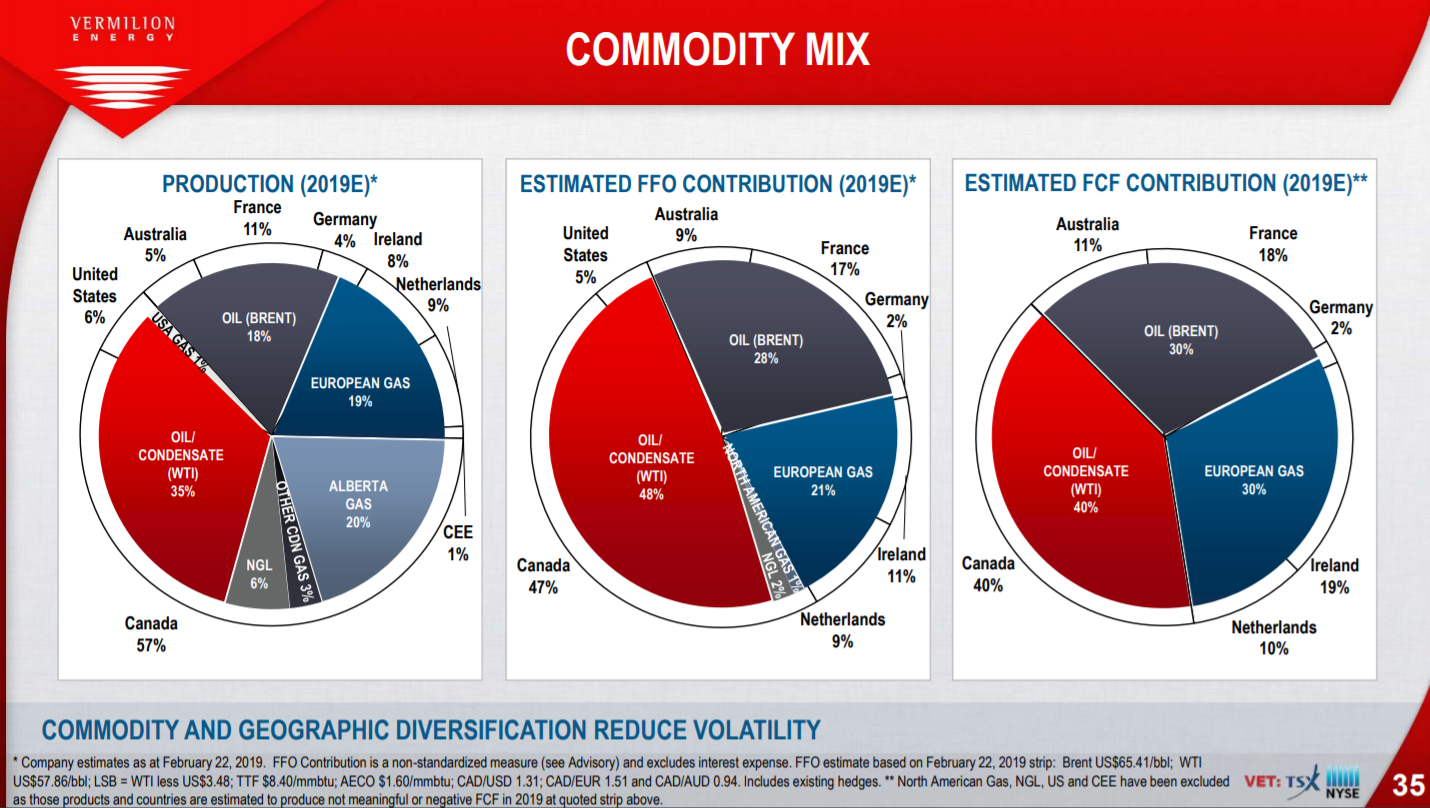
Source: Vermilion Energy March 2019 Investor Presentation, slide 35
Vermilion Energy was structured as an income trust at the time of the last recession, so its performance during that time is not comparable to the company’s performance today.
The company is reasonably leveraged today, and largely in line with its peers, so financing concerns during a recession appear manageable. Recessions generally come with lower commodity prices – oil included – so earnings would suffer.
That said, the dividend should be sustainable, as Vermilion has built a stable model that should be able to see it through any such downturn. Even so, this is a stock that likely will see significant downside price action should a recession strike, so it isn’t without risks.
Valuation & Expected Returns
Vermilion Energy’s future shareholder returns will be composed of valuation changes, growth in its underlying funds from operations, and the company’s current dividend yield.
We see the company’s growth in the low single digits given that its FFO-per-share has been so volatile in recent years. While certain years will see much higher rates of growth, depending upon the price action of oil, there could certainly be years of negative growth as well.
The dividend is yielding in excess of 8%, which adds materially to total projected returns. However, this stock is also very cheap at today’s prices, and we see the valuation as adding significantly as well.
We expect $8.70 in FFO-per-share for 2019, per management guidance, and with the share price under $34, Vermilion trades for just 3.9 times this year’s FFO.
That compares extremely favorably to our fair value estimate of 6.5 times FFO, which we believe will see shareholders enjoy a 10%+ tailwind to annual total returns.
Putting this all together, we see Vermilion as one of the most attractive stocks in our coverage universe today, with prospective total returns of about 20% annually.
Final Thoughts
Vermilion Energy appears to be quite attractive today. The company’s stock is cheap by any standard, it has a diversified business model that has been proven over decades, and the stock yields in excess of 8%.
The company also pays its dividends on a monthly basis, which makes it a very attractive investment for income-oriented investors.
Thus, this stock is a buy for investors looking to generate meaningful income from their investment portfolio.