

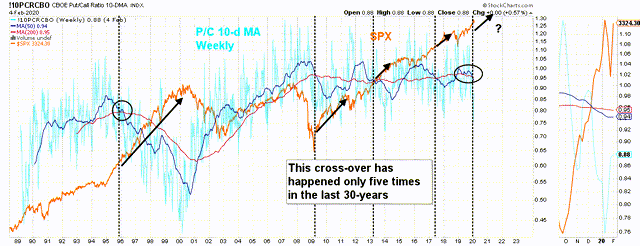
Only The Fifth Time in 30-years


The put:call ratio is a sentiment indicator that correlates negatively to the SPX.
The 50-day MA of the weekly 10-day MA of the total put:call ratio (I know it’s convoluted, but stay with me), has crossed under its 200-day MA only five times in the last thirty years (vertical black line). Each time it has done this, the SPX has rallied for a minimum of two years. The way the recent cross-over occurred, is similar to that of 1996 (black ovals) and adds evidence to our contention that the market situation today is similar to that time period. The 1996 cross-over unleashed a massive 4-year rally.
ANG Traders
Join us at www.angtraders.com and profit from our unique analysis.
Source Nicholas Gomez