


Published by Nicholas McCullum on May 1st, 2017
In many pursuits, newcomers are so far removed from the experts that it is difficult to learn from the best.
This is not the case with investing. Investors can easily learn from (and imitate) the investment decisions of successful institutional investors – the best in the business.
One example of this is Prem Watsa.
As the Chief Executive Officer of Fairfax Financial Holdings Ltd. (FRFHF), a Canadian insurance company, Watsa is the portfolio manager for an impressive sum of insurance float. About $1.1 billion of this is invested in publicly-traded common stocks.
Free Download: Get a free Excel spreadsheet of Prem Watsa’s comprehensive stock holdings with metrics that matter – including P/E ratio and dividend yield. Click here to download Watsa’s holdings now.
This article will analyze Prem Watsa’s dividend stock investment portfolio in detail.
Prem Watsa’s Investment Style
Prem Watsa is the Chairman and Chief Executive Officer of Fairfax Financial Holdings Ltd, a Canadian insurer and investment manager.
Fairfax’s operations are remarkably similar to those of Berkshire Hathaway (BRK.A) (BRK.B). The company’s insurance operations are consistently profitable (as measured by the combined ratio), which means that Fairfax is consistently generating useable capital known as insurance float.
I could give an adequate explanation of insurance float, but I’ll instead refer to Warren Buffett’s – the master of generating wealth via insurance float – explanation of insurance float from Berkshire Hathaway’s 2007 Annual Report.
“Insurance float – money we temporarily hold in our insurance operations that does not belong to us – funds $59 billion of our investments. This float is “free” as long as insurance underwriting breaks even, meaning that the premiums we receive equal the losses and expenses we incur. Of course, insurance underwriting is volatile, swinging erratically between profits and losses. Over our entire history, however, we’ve been profitable, and I expect we will average breakeven results or better in the future. If we do that, our investments can be viewed as an unencumbered source of value for Berkshire shareholders.”
Fairfax’s insurance float operates in precisely the same manner.
Prem Watsa’s excellent capital allocation skills and his use of insurance float have led him to be called the “Canadian Warren Buffett”.
Aside from the use of float and strong investment returns, Watsa’s investment style is notably different than Buffett’s in many ways.
First of all, Prem Watsa is active outside of the equity markets. While Warren Buffett is not known for investing in bonds, Watsa had (until recently) a very large stake in U.S. government bonds. He trimmed back this stake after the outcome of the U.S. Presidential Election – when he became more bullish – but he still owns short-term government bonds to this day.
Secondly, Prem Watsa actively engages in the derivatives markets.
Financial derivatives are securities that derive their value from the price of some other security (called the ‘underlying’). The most common examples of financial derivatives are call options and put options.
Watsa, however, prefers inflation-linked derivatives that will pay cash to Fairfax if major economies experience systemic deflation (a major sign of economic weakness).
Watsa gave a succinct explanation of these inflation-linked derivatives in Fairfax’s 2010 Annual Report:
“Say the consumer price index in the U.S. was 100 when we purchased this contract. In ten years’ time, if the CPI index is above 100 because of cumulative inflation, then our contract is worthless. On the other hand, if the index is below 100 because of cumulative deflation, then the contract will have value based on how much deflation we have had. If, for instance, the index is at 95 because of a cumulative 5% deflation over 10 years, the contract at expiry would be worth 5% of the notional value of the contract. That’s how it works!”
Watsa has also used financial derivatives to reduce his net equity exposure without having to hold cash, although he has reduced these equity hedges in recent months (similar to his sale of the majority of his U.S. corporate bonds).
Watsa’s investment in financial securities is highly unlike his American counterpart Warren Buffett. Buffett – and by extension, Berkshire Hathaway – has avoided derivatives in the past.
Related: 7 Enlightening Lessons from Berkshire Hathaway’s 2016 Annual Report
Table of Contents
Prem Watsa’s Fairfax Financial currently owns 16 dividend paying stocks. You can skip to analysis on each of these stocks by clicking on the links below. Note: This article covers only dividend stocks, so Watsa’s largest positions – Blackberry (BBRY) – is excluded from this list since it does not pay a dividend.
- National Oilwell Varco, Inc. (NOV)
- Leucadia National Corporation (LUK)
- The Valspar Corporation (VAL)
- NetEase, Inc. (NTES)
- General Dynamics Corporation (GD)
- Monsanto Company (MON)
- U.S. Bancorp (USB)
- Rayonier Advanced Materials Inc. (RYAM)
- Johnson & Johnson (JNJ)
- Wells Fargo & Company (WFC)
- Kennedy-Wilson Holdings, Inc. (KW)
- International Business Machines (IBM)
- Pfizer, Inc. (PFE)
- Baldwin & Lyons, Inc. (BWINB)
- Helmerich & Payne, Inc. (HP)
- POSCO (PKX)
National Oilwell Varco, Inc. (NOV)
Dividend Yield: 0.6%
Adjusted Price-to-Earnings Ratio: N/A (negative earnings)
Percent of Prem Watsa’s Portfolio: 0.0% (very small)
Fairfax Financial owns 6,400 shares of National Oilwell Varco with a market value of $240,000. It is a relatively small position in Watsa’s investment portfolio.
National Oilwell Varco is a leading supplier of components and equipment for the oil and gas industry.
The company operates in three main segments:
- NOV Rig Systems – Creates advanced drilling solutions
- NOV Wellbore Technologies – Creates technologies to improve productivity and efficiency
- NOV Completion & Production Solutions – Helps customers complete projects on time and on budget
The company’s revenues are approximately evenly distributed across land and offshore drilling.

Source: NOV Presentation at the Scotia Howard Weil 2017 Energy Conference, slide 7
NOV has invested heavily in predictive analytic to improve the experience of its end customers.
The slide below shows an example of the company predicting the maintenance of a regulator valve, and delivering the spare part accordingly.

Source: NOV Presentation at the Scotia Howard Weil 2017 Energy Conference, slide 18
As a services company, finding ways to minimize downtime (such as the method displayed in slide above) will improve productivity and efficiency. This will improve margins and other financial efficiency metrics.
Indeed, National Oilwell Varco’s financial numbers are strong. The company generates the highest free cash flow as a proportion of revenues out of its ‘Big Four’ peer group.

Source: NOV Presentation at the Scotia Howard Weil 2017 Energy Conference, slide 41
Looking ahead, many investors are curious if we are on the brink of the next economic recession.
If this is indeed the case, National Oilwell Varco is well-poised to thrive from a financial perspective.
The company sports a BBB+ investment-grade credit rating.
National Oilwell Varco also has $1.4 billion of cash on hand and total current liquidity of $5.9 billion (this compares favorably to the company’s $13.9 billion market capitalization).

Source: NOV Presentation at the Scotia Howard Weil 2017 Energy Conference, slide 43
National Oilwell Varco appears to be a turnaround play in Prem Watsa’s portfolio – the stock traded for as high as $86 in 2014 and now trades at $36.16.
This drop in stock price has been accompanied by a reduction in earnings. The company reported negative earnings-per-share for fiscal 2016. Accordingly, it cannot be meaningfully analyzed using the price-to-earnings ratio.
Low earnings have impacted the dividend of National Oilwell Varco. The company cut its dividend from $0.46 to $0.05 last year, and the current forward dividend yield is 0.6%.
Investors should be wary of this company – its large net losses for fiscal 2016 will lead to bankruptcy unless performance improves soon.
Leucadia National Corporation (LUK)
Dividend Yield: 1.0%
Adjusted Price-to-Earnings Ratio: 76.9x
Percent of Prem Watsa’s Portfolio: 0.6%
Prem Watsa holds 300,000 shares of the Leucadia National Corporation with a market value of $7.0 million.
The Leucadia National Corporation is a conglomerate engaged in a wide variety of businesses, including telecommunications, healthcare, manufacturing, and banking.
Because of its diverse business mix, Leucadia has been called the ‘baby Berkshire Hathaway‘ by some investors.
The companies diverse holdings can be seen in the following diagram.

Source: Leucadia 2016 Investor Presentation, slide 2
Leucadia has grown significantly over the years.
The number of owned business has increased 80% since 2012. Further, the company has a much greater degree of diversification than it did in the past.
Leucadia’s risk metrics have also improved, with the company making progress in its liquidity ratio and leverage ratio.

Source: Leucadia 2016 Investor Presentation, slide 3
Leucadia’s largest (and most important) holding is Jefferies, a global investment bank and securities firm. Jefferies operates in the following segments:
- Investment Banking
- Equities
- Fixed Income
When most people think of an investment bank like Jefferies, they become concerned about risk.
However, Jefferies benefits from an attractive long-term debt profile. The subsidiary’s $5.2 billion in long-term debt has a weighted average maturity of ~8 years, and the company makes good use of convertible notes.

Source: Leucadia 2016 Investor Presentation, slide 46
Right now, Leucadia is not attractively valued. The company reported earnings-per-share of $0.34 for fiscal 2016, and its current stock price of $26.15 represents a price-to-earnings ratio of 76.9. This price is very elevated and reminiscent of dot-com bubble valuations.
Stocks with such high valuation cannot sustainably have high dividend yield. This holds true for Leucadia.
Leucadia currently pays a quarterly dividend of $0.0625, or $0.25 annually. This represents a paltry dividend yield of 1.0%.
Leucadia’s sky-high valuation and low dividend yield would lead to a poor ranking using The 8 Rules of Dividend Investing. Investors can find higher dividend yields and more attractive valuations elsewhere.
The Valspar Corporation (VAL)
Dividend Yield: 1.1%
Price-to-Earnings Ratio: 25.8x
Percent of Prem Watsa’s Portfolio: 0.06% (very small)
Fairfax Financial owns 6,200 shares of the Valspar Corporation with a market value of $643,000.
Valspar is a global leader in the paint and coatings industry. The company offers traditional and value-added products to consumers in more than 100 countries.
For Valspar shareholders, the primary current event of interest is the pending acquisition by Sherwin-Williams (SHW), which was originally announced in March of 2016.
The acquisition is expected to drive growth through synergies between the two businesses and will be immediately accretive to the proforma company’s earnings-per-share.
More details about the benefits of the acquisition can be seen below.

Source: Valspar & Sherwin-Williams Merger Presentation, slide 1
The acquisition is being completed on an all-cash basis.
Existing Valspar shareholders will receive $113 in cash per Valspar share, which represented a 41% premium to the average stock price leading up to the announcement. Further, this represented a 28% premium to the all-time high closing price.
Valspar is currently trading at $112.44 per share. The razor-thin arbitrage spread of $0.56 indicates that the markets have a high degree of confidence that this acquisition will close.
More details about the mechanics of the transaction can be seen below.

Source: Valspar & Sherwin-Williams Merger Presentation, slide 2
The proforma company will benefit from being the undisputed leader in the global paints and coatings industry, with higher annual sales than the current industry leader – PPG Industries (PPG).
The global paints and coatings industry will remain highly fragmented even after the second (Sherwin-Williams) and fifth (Valspar) largest companies merge. This means that Sherwin-Williams can still pursue opportunistic acquisitions to drive the growth of its business.

Source: Valspar & Sherwin-Williams Merger Presentation, slide 5
The proforma company will also be much more diversified.
Currently, Sherwin-Williams generates a very large proportion of its revenues from its Paint Stores segment.
The acquisition will reduce the proforma company’s reliance on this retail segment.

Source: Valspar & Sherwin-Williams Merger Presentation, slide 6
The new Sherwin-Williams will also benefit from significant cost synergies.
Valspar and Sherwin-Williams currently operate very similar business models. It makes sense, then, that the proforma company will be able to eliminate duplicate roles and become leaner as a result.
The company’s expected cost synergies can be seen in the following diagram.
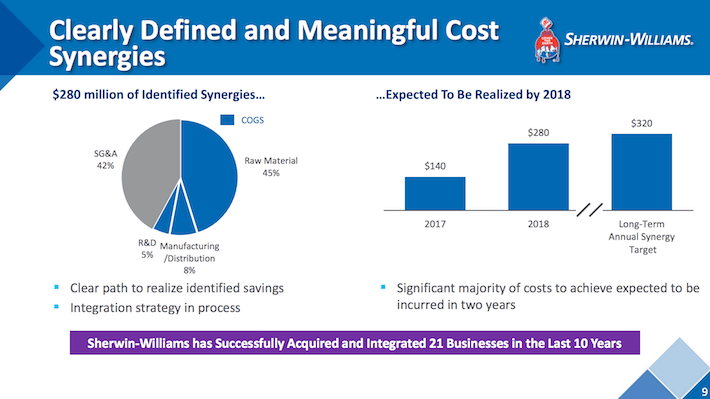
Source: Valspar & Sherwin-Williams Merger Presentation, slide 9
The deadline for the closure of the Valspar has been extended to June 21, and Sherwin-Williams management stated on their first quarter conference call that they expect the acquisition to be finalized before then.
If the transaction closes on precisely June 21, the current $0.56 arb spread represents an IRR of less than 1%. Thus, investors should not view Valspar as a merger arbitrage opportunity.
Valspar is not particularly attractive on a fundamental basis, either, mostly because of a run-up in price following the acquisition’s announcement.
Valspar reported earnings-per-share of $4.36 in fiscal 2016. Today’s stock price of $112.44 represents a 25.8x multiple of 2016’s earnings. The company is priced in-line with the market, though its long-term prospects are irrelevant because current shareholders are likely to be bought out in cash come June 21.
The company’s current quarterly dividend of $0.33 per share represents a forward dividend yield of 1.2%.
Valspar is a low yield dividend stock, but has shown a commitment to raising its dividend over time – it is a member of the S&P High Yield Dividend Aristocrats index. It’s acquiring company, Sherwin-Williams, is a Dividend Aristocrat – a group of companies with 25+ years of consecutive dividend increases.
You can see the list of all 51 Dividend Aristocrats here.
With all this in mind, Valspar does not present a compelling investment opportunity ahead of its acquisition. Investors looking for exposure to the global paints and coatings industry would be better off purchasing Sherwin-Williams directly.
If you’re interested in reading more analysis about the Valspar Corporation, the following article might be of interest:
- Here’s What To Do About Sherwin-Williams Acquisition of Valspar
- Dividend Aristocrats in Focus Part 8: Sherwin-Williams (contains information about the acquisition and the new parent company)
NetEase, Inc. (NTES)
Dividend Yield: 1.5%
Adjusted Price-to-Earnings Ratio: 21.0
Percent of Prem Watsa’s Portfolio: 0.06% (very small)
Fairfax Financial owns 3,000 shares of NetEase, Inc. with a market value of $646,000.
NetEase is a Chinese Internet company that focuses on email services, PC and mobile games, eCommerce, and internet media.

Source: NetEase 4Q2016 Investor Presentation, slide 17
The company was founded in 1997 and was a key contributor in the Internet revolution in China. Today, NetEase has a market capitalization above $30 billion and has American Deposit Shares that trade on the NASDAQ stock exchange under the ticker NTES.
More details about NetEase’s current scale can be seen below.

Source: NetEase 4Q2016 Investor Presentation, slide 4
2016 was a fantastic year for NetEase from a financial perspective.
The company saw adjusted earnings-per-ADS (hereafter earnings-per-share) increase by an eye-popping 72% on the back of a 67% increase in net revenue.

Source: NetEase 4Q2016 Investor Presentation, slide 5
Looking ahead, NetEase’s growth will be largely driven by its growing portfolio of mobile games.
The company has over 100 titles in its game portfolio, four of which ranked among the top 10 highest grossing games in the China iOS store for the Apple (AAPL) iPhone.

Source: NetEase 4Q2016 Investor Presentation, slide 8
NetEase also has a solid balance sheet, which should please investors who are concerned about the risks of investing in the international technology industry.
The company has cash & cash equivalents of $6.0 billion (or ~18% of its total market capitalization), which leaves plenty of capital available for internal reinvestment or opportunistic acquisitions.
Further, the company’s total liabilities of $11.8 billion compare favorably to its total shareholder’s equity of $29.3 billion.
More detail about NetEase’s balance sheet can be seen below.

Source: NetEase 4Q2016 Investor Presentation, slide 17
NetEase’s current stock price of $265.40 represents a 21.0x multiple of 2016’s adjusted earnings-per-share of $12.64.
NetEase appears reasonably valued right now, particularly for a technology company. For context, the S&P 500’s current price-to-earnings ratio is approximately 25.
NetEase currently pays a quarterly dividend of $1.01 per ADS. Today’s price of $265.40 means the company’s U.S. offering is priced at a dividend yield of 1.5%.
NetEase has a below-average price-to-earnings ratio and is experiencing rapid growth right now. Accordingly, it is the first stock on this list that I would recommend for further research.
General Dynamics Corporation (GD)
Dividend Yield: 1.7%
Adjusted Price-to-Earnings Ratio: 19.7x
Percent of Prem Watsa’s Portfolio: 0.0% (very small)
Prem Watsa’s investment portfolio holds 1,500 shares of the General Dynamics Corporation with a market value of $259,000.
General Dynamics is a major aerospace and defense company with headquarters in Fairfax Country, Virginia.
The company operates in four main segments:
- Aerospace (27% of 2016 revenue)
- Combat Systems (18% of 2016 revenue)
- Information Systems and Technology (29% of 2016 revenue)
- Marine Systems (26% of 2016 revenue)
General Dynamics’s revenue by segment can be seen visually below.

Source: Data from General Dynamics Fourth Quarter Earnings Release, chart created by author
General Dynamics has a strong competitive advantage due to its presence in the highly regulated and contract-based defense industry.
New companies cannot immediately compete in this industry without first getting the necessary security clearances.
General Dynamics also has a substantial backlog of booked (but not completed) business, which gives the company some predictability when it comes to revenue.
General Dynamics’ backlog by segment can be seen below.

Source: Data from General Dynamics Fourth Quarter Earnings Release, chart created by author
This backlog has helped General Dynamics to perform exceptionally well during economic recessions.
For example, the company was able to increase its adjusted earnings-per-share during each year of the 2008-2009 financial crisis.
- 2007: $5.10
- 2008: $6.13 (20.2% increase)
- 2009: $6.20 (1.1% increase)
- 2010: $6.82 (10.0% increase)
- 2011: $6.94 (1.8% increase)
Looking ahead, General Dynamics is expected to benefit from boosts to defense spending under the new Trump administration. This has increased the company’s stock price in anticipation of increased earnings.
General Dynamics current stock price of $194.85 represents a 19.7x of 2016’s adjusted earnings-per-share of $9.87. A 20x multiple of adjusted earnings is a reasonable price to pay for a high-quality business like General Dynamics right now since stock market valuations are propped up by low interest rates.
The company is also quite shareholder-friendly. General Dynamics recently announced a 10.5% increase to its quarterly dividend to $0.85 per share and announced the authority to buy back an additional 10 million shares of company stock.
The company’s new dividend yield is 1.7% and its share repurchase program will be a tailwind to the company’s future earnings-per-share.
General Dynamics is trading at a reasonable valuation right now and is one of the newest Dividend Aristocrats. The company merits further research due to its strong growth potential, recession resiliency, and shareholder-friendly management.
If you’re interested in reading more analysis about the General Dynamics Corporation, the following article might be of interest:
- Dividend Aristocrats in Focus: General Dynamics
- Next Year’s 4 New Dividend Aristocrats: One Is Priced To Buy Now
- Why General Dynamics Is About To Fire Off A Strong Dividend Increase
Monsanto Company (MON)
Dividend Yield: 1.9%
Adjusted Price-to-Earnings Ratio: 26.1
Percent of Prem Watsa’s Portfolio: 0.06% (very small)
On behalf of Fairfax Financial, Prem Watsa has purchased 6,200 shares of the Monsanto Company with a market value of $653,000. Monsanto is also a holding in the stock portfolio of legendary investor Warren Buffett.
Monsanto is a global agrochemical and agricultural biotechnology company with headquarters in Missouri and a market capitalization of $52 billion.
The Monsanto business is divided into two operating segments:
- Seeds and Traits
- Crop Protection
For Monsanto shareholders, one of the key recent developments is the company’s pending acquisition by Bayer.
This merger, which was originally announced in September, will see the two companies combine into a research-focused agricultural institution.
Details about the perceived benefits of the transaction can be seen below.

Source: Monsanto Presentation at the 2016 Citi Basic Materials Conference, slide 5
This transaction will be completed on an all-cash basis.
Existing Monsanto shareholders will receive $128 per share, and the transaction has been unanimously approved by the boards of both Monsanto and Bayer.
The transaction is expected to be completed by the end of calendar 2017.

Source: Monsanto Presentation at the 2016 Citi Basic Materials Conference, slide 7
Even without the Monsanto-Bayer merger, Monsanto is expected to return to earnings-per-share growth for fiscal 2017 after a disappointing 2016 that saw adjusted earnings-per-share decrease by ~22%.
The company is expecting ongoing earnings-per-share of $4.50-$4.90. Earnings anywhere within this guidance band will be an improvement over 2016’s $4.48 number.

Source: Monsanto Presentation at the 2016 Citi Basic Materials Conference, slide 8
With that said, Monsanto is still not an appealing investment right now.
The company’s current stock price of $116.74 represents a 26.1x multiple of 2016’s adjusted earnings-per-share. Monsanto is trading in-line with the average stock market valuation right now despite experiencing declining growth in its most recent fiscal year.
The company is not an overly appealing dividend investment, either.
Monsanto’s current quarterly dividend payment of $0.54 represents a forward dividend yield of 1.9% – below the S&P 500’s average dividend yield of 2.0%.
Thus, Monsanto does not appear to be an overly attractive fundamental investment right now. However, there may be a merger arbitrage opportunity here, as the company’s current stock price has a $11.26 spread below the cash payout for Monsanto shareholders going into the merger.
If you’re interested in reading more analysis about the Monsanto Corporation, the following article might be of interest:
U.S. Bancorp (USB)
Dividend Yield: 2.1%
Adjusted Price-to-Earnings Ratio: 16.0
Percent of Prem Watsa’s Portfolio: 1.8%
Prem Watsa has purchased 408,000 shares of U.S. Bancorp for Fairfax Financial with a market value of $21.0 million.
U.S. Bancorp is also a holding in Berkshire Hathaway’s investment portfolio managed by legendary value investor Warren Buffett.
U.S. Bancorp is a bank holding company that owns the U.S. Bank, which is the fifth-largest bank in the United States by most metrics.
U.S. Bancorp benefits from the size and scale of its primary subsidiary. Some of the company’s key stats for fiscal 2016 can be seen below.

Source: U.S. Bancorp 2017 Annual Meeting Presentation
U.S. Bancorp has a key competitive advantage that stems from its remarkable operational efficiency.
The company ranks number 1 in each of Return on Capital Employed (ROCE), Return on Assets (ROA) and Efficiency Ratio.
U.S. Bancorp also has a wide lead over each of its next competitors for these metrics, which can be seen below.

Source: U.S. Bancorp 2017 Annual Meeting Presentation, slide 32
Investors might be wary of financial companies because of what happened during the last recession. Many financial institutions cut their dividend payments and required government intervention to avoid becoming insolvent.
Fortunately for U.S. Bancorp investors, the company is considered to be highly creditworthy.
U.S. Bancorp has a higher credit rating than many larger institutions like J.P. Morgan (JPM) and Wells Fargo.

Source: U.S. Bancorp 2017 Annual Meeting Presentation, slide 33
U.S. Bancorp also stacks up favorably against the broader corporate landscape on metrics such as management quality, use of corporate assets, and financial soundness, according to Fortune.

Source: U.S. Bancorp 2017 Annual Meeting Presentation, slide 35
The company reported earnings-per-share of $3.24 for fiscal 2016. Today’s stock price of $52.12 represents 16.0x multiple of 2016’s earnings-per-share. This is well below the average valuation in the stock market, but still above the company’s average price-to-earnings ratio of 13 since 2000.
With that said, U.S. Bancorp remains a strong dividend stock. The company’s most recent quarterly dividend was in the amount of $0.28 per share, or $1.12 annually. This is good for a dividend yield of 2.1% at prevailing market prices.
If you’re interested in reading more analysis about U.S. Bancorp, the following article might be of interest:
Rayonier Advanced Materials Inc. (RYAM)
Dividend Yield: 2.1%
Adjusted Price-to-Earnings Ratio: 9.3x
Percent of Prem Watsa’s Portfolio: 0.05% (very small)
Fairfax Financial owns 35,000 shares of Rayonier Advanced Materials Inc. with a market value of $541,000.
Rayonier Advanced Materials is the leading global supplier of high-purity cellulose products.
The company was spun off in the summer of 2014 from Rayonier (RYN), a timber real estate investment trust.
While spinoffs can often unlock shareholder value, this stock is the exception. The stock has traded as high as $43 in the period immediately following the spinoff but has a current stock price of just $13.25 – a decrease of ~70%.
Rayonier is quite a small company, with a market capitalization of $585 million.
The company’s financial metrics are proportionally small. Rayonier generated $869 million of revenue in 2016, with operating income of $138 million.

Source: Rayonier 2017 Investor Day Presentation, slide 7
Rayonier operates high on the value chain of the pulp and paper industry, which is known as the Cellulose Specialties industry.
The materials produced by this company are high strength and priced accordingly.

Source: Rayonier 2017 Investor Day Presentation, slide 8
Rayonier’s business has been under pressure recently due to flat demand for acetate products, a supply/demand imbalance in its major product categories, and the strong U.S. dollar lowering the expense of Rayonier’s more internationally-focused competitors.
However, the company has created a strategic plan to both improve business performance and de-risk its operations.
Rayonier is aiming to become a much larger and diversified business, fueling this growth by internal and external investment ideas.

Source: Rayonier 2017 Investor Day Presentation, slide 39
Rayonier’s growth plan is centered on four pillars:
- Cost Transformation
- Market Optimization
- New Products
- Acquisitions
Each is elaborated on below.

Source: Rayonier 2017 Investor Day Presentation, slide 38
In the meanwhile, Rayonier continues to operate with a reasonable capital structure.
The company’s current interest coverage sits at 6.7x. This is well above the financial covenant requirement of >3.0x.
Further, I would argue that if Rayonier’s earnings decline by more than a factor of 6.7, then investors have much more to be worried about than the repayment of debt.

Source: Rayonier 2017 Investor Day Presentation, slide 43
Rayonier benefits not just from the quality of its balance sheet, but from the composition.
Much of the company’s debt has been financed at rock-bottom interest rates, including a Farm Credit Term Loan with a balance of $251 million and an interest rate of just 1.84%.

Source: Rayonier 2017 Investor Day Presentation, slide 44
Rayonier pays a quarterly dividend of $0.07 per share. The company’s current stock price of $13.25 is priced at a forward dividend yield of 2.1% – just above the S&P 500’s average dividend yield of 2.0%.
Rayonier reported adjusted earnings-per-share of $1.43 for fiscal 2016. The company’s current stock price is a 9.3x multiple of 2016’s earnings. This is well below the S&P 500’s current price-to-earnings ratio of ~25.
While Rayonier Advanced Materials might seem like an absolute bargain based on fundamental valuation metrics, keep in mind that the company has destroyed a substantial amount of shareholder value since its spin off. Further, Rayonier is a small cap stock and has more inherent risk as a result.
Johnson & Johnson (JNJ)
Dividend Yield: 2.7%
Adjusted Price-to-Earnings Ratio: 18.4x
Percent of Prem Watsa’s Portfolio: 1.5%
Prem Watsa’s Fairfax Financial owns 151,250 shares of Johnson & Johnson with a market value of $17.4 million. Johnson & Johnson is also a holding in Warren Buffett’s stock portfolio.
Johnson & Johnson is a healthcare conglomerate that operates in three main segments:
- Pharmaceuticals
- Medical Devices
- Consumer Health Products
The company is well-known for its iconic consumer brands including Johnson’s, Listerine, and Tylenol, among others.

Source: Johnson & Johnson 2017 CAGNY Presentation, slide 5
Johnson & Johnson is an extremely diversified business.
The company has 24 brands or products with more than $1 billion in annual sales. For comparison, Coca-Cola (KO) has 21 brands with $1 billion in annual sales and Pepsi has 22 brands with $1 billion in annual sales.
Considering that consumer products are only a portion of Johnson & Johnson’s overall business, this is very impressive.
Johnson & Johnson’s consumer products are also diversified a number of categories, as outlined in the following diagram.

Source: Johnson & Johnson 2017 CAGNY Presentation, slide 8
It should be of no surprise that Prem Watsa owns a slice of Johnson & Johnson – this healthcare company is one of the highest quality businesses that I have seen.
Johnson & Johnson is one of only two companies to hold the coveted AAA credit rating from Standard & Poor’s (with the other being Microsoft (MSFT)) and has increased its constant-currency adjusted earnings-per-share for an amazing 33 consecutive years.

Source: Johnson & Johnson 2017 CAGNY Presentation, slide 53
Johnson & Johnson is also a remarkably shareholder-friendly business. The company has increased its annual dividend payments for 55 consecutive years.
This qualifies Johnson & Johnson to be a member of the Dividend Kings – a group of elite stocks with 50+ years of annual dividend increases.
You can see all 19 Dividend Kings analyzed in detail here.
The impressive dividend streak of Johnson & Johnson has been a key contributor to the company’s impressive total return history. The company has outperformed both the S&P 500 and its Competitor Composite index during all meaningful time periods.

Source: Johnson & Johnson 2017 CAGNY Presentation, slide 54
Johnson & Johnson has an above-average dividend yield. The company recently increased its quarterly dividend by 5% to $0.84 per share, which is good for a yield of 2.7% at today’s market price of $123.61.
The company is also an attractive value at today’s prices. Johnson & Johnson reported adjusted earnings-per-share of $6.73 for fiscal 2016, which means today’s stock price is a 18.4x multiple of 2016’s earnings.
I would expect a high-quality company like Johnson & Johnson to trade at a price-to-earnings ratio of at least 20x. This stock provides rare value among blue-chip stocks in today’s market.
If you’re interested in reading more analysis about Johnson & Johnson, the following article might be of interest:
- Top 15 Low Volatility Dividend Aristocrats (hint: Johnson & Johnson is number one)
- Johnson & Johnson: Modest Price Decline Presents Buying Opportunity
- Four Companies Impacted by the Strength of the U.S. Dollar
- These 4 Stable, Inflation-Protected Stocks Are Likely To Be Around in 50 Years
Wells Fargo & Company (WFC)
Dividend Yield: 2.8%
Adjusted Price-to-Earnings Ratio: 13.5
Percent of Prem Watsa’s Portfolio: 0.3%
Fairfax Financial owns 65,800 shares of Wells Fargo & Company with a market value of $3.6 million. Wells Fargo is also a core holding in the portfolio of legendary investor Warren Buffett.
Wells Fargo is one of the largest banks in the United States with nearly $2 trillion in assets (third among domestic banks). The bank was founded in 1852 and has since grown to more than 8,600 locations, 13,000 ATMs, as well as countless mobile and online banking connections.
Wells Fargo recently reported its fiscal 2016 financial results. Performance was satisfactory, though the bank saw a minor downturn in earnings-per-share and net income.
However, fundamental banking metrics remained strong. The company saw an increase in revenues, average loans, net interest income, and average deposits.

Source: Wells Fargo Presentation at the Credit Suisse Financial Services Forum, slide 2
Wells Fargo operates a remarkably diversified business model.
Banks are divided into two revenue streams – interest income from loans, lines of credit, credit cards, etc., and non-interest income (sometimes called fee income) which is less sensitive to changes in market interest rates.
The following diagram provides a breakdown of Wells Fargo’s interest income and non-interest income by source.

Source: Wells Fargo Presentation at the Credit Suisse Financial Services Forum, slide 3
This high level of operational diversification helps to protect Wells Fargo (and its investors) from any regional economic downturn that might result in loan defaults.
Wells Fargo also has robust cost control processes, which has been one of their keys to increasing earnings-per-share as interest rates have decreased.
The company’s efficiency ratio (calculated by dividing non-interest expenses by total revenue) is the third lowest among its peer group. We saw earlier in this article that U.S. Bancorp has the leading efficiency ratio among United States banks, and this is reflected in Wells Fargo’s presentation as well.

Source: Wells Fargo Presentation at the Credit Suisse Financial Services Forum, slide 11
Wells Fargo has also managed to survive in a world were the company’s net interest margin continues to decline.
The fllowing diagram shows that, although NIM has been decreasing, net interest income has actually been increasing. This bodes well for Wells Fargo as interest rates are expected to rise – the Federal Reserve has communicated the intent to increase interest rates three times during 2017.

Source: Wells Fargo Presentation at the Credit Suisse Financial Services Forum, slide 8
One of the most important recent developments for Wells Fargo shareholders was the scandal that emerged last September surrounding sales pressure in retail branches.
Retail bank employees were found to have opened unauthorized checking accounts and credit cards in a widespread problem that resulted from excessive pressure to meet sales goals.
Wells Fargo recently announced their new Retail Banking compensation program, which seeks to rectify these issues. Details of this compensation program can be seen below.

Source: Wells Fargo Presentation at the Credit Suisse Financial Services Forum, slide 19
Wells Fargo currently pays a quarterly dividend of $0.38 per share, which is good for a dividend yield of 2.8% based on the current stock price of $53.98.
Wells Fargo is also priced below the market’s average valuation. After reporting earnings-per-share of $3.99 in fiscal 2016, Wells Fargo is currently trading at a price-to-earnings ratio of 13.5.
For investors that believe that the sales pressure concerns are in the past for Wells Fargo, the company is a healthy source of financials exposure and dividend income.
If you’re interested in reading more analysis about Wells Fargo, the following article might be of interest:
- Better Bank Dividend Stock: Wells Fargo or JP Morgan Chase?
- Is Wells Fargo Still A Good Dividend Investment With Increased Regulation?
Kennedy-Wilson Holdings, Inc. (KW)
Dividend Yield: 3.4%
Adjusted Price-to-Earnings Ratio: 11.6x
Percent of Prem Watsa’s Portfolio: 21.6%
Prem Watsa’s portfolio contains 12,321,921 shares of Kennedy-Wilson Holdings with a market value of $252 million.
At 21.6% of Fairfax’s investment portfolio, Kennedy-Wilson is the first dividend stock on this list to occupy more than 5% of Prem Watsa’s invested assets. It is also his second-largest individual position behind Blackberry Limited.
Kenney-Wilson is a global real estate company that both owns and manages properties across the globe.
The company has an impressive track record. Although its market capitalization currently sits at $2.3 billion, the company controls an investment portfolio with a carrying value of ~$11 billion of which Kennedy-Wilson has an average 42% stake in.
More details about Kennedy-Wilson’s core business can be seen below.

Source: Kennedy-Wilson Holdings Fourth Quarter Investor Presentation, slide 4
Kennedy-Wilson recently reported financial results for the fourth quarter of 2016.
The business continued to show strong growth. Net operating income from Kenney-Wilson’s owned properties increased by 17% for the year and 11% for the quarter.
The company continued to pass on this business performance to its shareholders. The company increased its quarterly dividend payment to $0.17 this year, which was the company’s 6th consecutive annual dividend increase and represents a 325% boost to shareholder income since 2011.

Source: Kennedy-Wilson Holdings Fourth Quarter Investor Presentation, slide 5
Kennedy-Wilson’s intrinsic value is largely derived from its portfolio of income-producing real estate assets.
The firm continues to improve and expand this portfolio, with $1.3 billion in new developments currently under contruction.
More details about Kennedy-Wilson’s development efforts can be seen below.

Source: Kennedy-Wilson Holdings Fourth Quarter Investor Presentation, slide 9
Kennedy-Wilson’s real estate portfolio has a high degree of inherent diversification, both across real estate types and through different geographies.
The company breaks these down by ‘investment account’, and though the company has a higher proportion of its assets outside the United States, the vast majority of its investment accounts are in the Western United States.
This indicates that Kennedy-Wilson serves a large number of small clients based on the West Coast.
By product type, the majority of Kennedy-Wilson’s clients are invested in commercial or multifamily properties. Only 1% of the company’s client accounts are invested in loans, which investors should view as positive because financial products are prone to poor performance during recessions.
More details about Kennedy-Wilsons client account breakdown can be seen below.

Source: Kennedy-Wilson Holdings Fourth Quarter Investor Presentation, slide 8
Kennedy-Wilson has a very globalized business model.
The company operates 5 million square feet of commercial real estate in the United States.
Kennedy-Wilson’s domestic real estate holdings are highly concentrated on the West Coast, particularly surrounding Seattle, San Francisco, and Los Angeles.
More detail about Kennedy-Wilson’s domestic property holdings can be seen below.

Source: Kennedy-Wilson Holdings Fourth Quarter Investor Presentation, slide 11
For comparison, the company owns 13 million of commerical real estate in Europe – 2.6x their presence in the United States. This includes 1,827 apartments and 3 hotels.
The company is spread across many European countries. More details about Kennedy-Wilson’s international operations can be seen below.

Source: Kennedy-Wilson Holdings Fourth Quarter Investor Presentation, slide 12
From an investment perspective, Kennedy-Wilson has an attractive business model. The company is always searching for new real estate deals for its customers and has the option the invest alongside them in the deals it views as most attractive.
Often, the company will invest alongside its sister company Kennedy Wilson Europe Real Estate PLC, which trades on the London Stock Exchange under the ticker KWE.

Source: Kennedy-Wilson Holdings Fourth Quarter Investor Presentation, slide 14
For investors looking for a bit of international exposure, Kennedy-Wilson may be an attractive option. It’s overseas exposure is about to increase substantially.
On April 24, Kennedy Wilson announced a merger with its cousin Kennedy Wilson Europe Real Estate. This will bolster the company’s international portfolio of properties.
Investors who buy Kennedy-Wilson right now benefit from the company’s recently announced quarterly dividend of $0.17 per share, which is a 21% increase over the previous quarterly dividend payment. This payout is good for a yield of 3.4% based on the current stock price of $20.25.
The company is also presented compelling value at current prices.
Kennedy-Wilson reported adjusted net income of $191.3 million or 2016, or $1.74 per share. The company’s current per-share market value of $20.25 is priced at 11.6x multiple of 2016’s adjusted earnings.
Based on the company’s above-average dividend yield and rock-bottom valuation, Kennedy-Wilson merits further research for investors looking to piggyback off of Prem Watsa’s historical investing success.
International Business Machines Corporation (IBM)
Dividend Yield: 3.5%
Adjusted Price-to-Earnings Ratio: 11.8
Percent of Prem Watsa’s Portfolio: 19.4%
Fairfax Financial owns 1,361,900 shares of International Business Machines Corporation with a market value of $226 million – or 19.4% of the company’s investment portfolio. IBM is also a notable holding in Berkshire Hathaway’s investment portfolio, managed by the Oracle of Omaha Warren Buffett.
While certainly a technology company, IBM has much less inherent risk than many of its smaller, less profitable peers like Snapchat (SNAP) or Twitter (TWTR). This is largely due to the size and stability of IBM.
The company is a behemoth, with $21.8 billion and $79.9 billion of revenues in the fourth quarter and full-year of 2016, respectively. This allows IBM to benefit from significant economies of scale and pass these savings onto its shareholders.

Source: IBM Fourth Quarter Investor Presentation, slide 3
In recent years, IBM’s business has been undergoing a period of substantial change in its underlying business.
Until recently, IBM had owned declining legacy businesses whose revenues and profits were shrinking. This was worrying investors.
IBM has addressed these fears by focusing on what are known as its ‘strategic imperatives’ – big data and analytics, cloud, and engagement.
IBM has invested more than $30 billion in advancing these imperatives over the past five years. Now, the company’s strategic imperatives revenues are ~$33 billion – or 41% of IBM’s 2016’s revenues.

Source: IBM Fourth Quarter Investor Presentation, slide 4
While IBM is certainly changing, investors can rest assured that this company is here for the long run.
The company has robust cash flow and a solid balance sheet.
IBM generated $4.7 billion and $11.6 billion of free cash flow in the fourth quarter and full-year of 2016, respectively. The company allocates this capital in a shareholder-friendly manner, spending ~76% of free cash flow on dividend payments and share repurchases in 2016.
Further, IBM has plenty of available liquidity.
The company finished 2016 with $8.5 billion in cash and marketable securities. While this does not quite measure up to the company’s level of total debt ($42.2 billion), the company has taken advantage of low interest rates to finance its growth over the longer term.

Source: IBM Fourth Quarter Investor Presentation, slide 11
IBM currently pays a quarterly dividend of $1.40 per share, which is good for a dividend yield of 3.5% based on today’s stock price of $160.42.
Investors generate approximately 75% more income from IBM than they do from investing in an S&P 500 index fund, which is particularly impressive given that IBM is a technology company.
IBM is also a strong value investment at current prices.
The company reported adjusted earnings-per-share of $5.01 for fiscal 2016. The current quotation of $160.42 represents a 11.8x multiple of 2016’s adjusted earnings. IBM is an absolute bargain right now, especially compared to other high-flying large-cap technology stocks like Google (GOOG) and Amazon (AMZN).
If you’re interested in reading more analysis about International Business Machines, the following article might be of interest:
- IBM: 3.4% Yielding Dividend Achiever With Its Head In The Cloud
- What You Need To Know About IBM Before Buying [Or Selling]
Pfizer Inc. (PFE)
Dividend Yield: 3.8%
Adjusted Price-to-Earnings Ratio: 14.1
Percent of Prem Watsa’s Portfolio: 0.58%
Fairfax Financial owns 210,000 shares of Pfizer Inc. with a market value of $6.8 million.
Pfizer is a global pharmaceutical company that operates in two main segments:
- Innovative Products
- Established Products
More than half of Pfizer’s revenues are generated outside the United States, which is beneficial for investors looking for some international portfolio exposure.
2016 was another strong year for Pfizer. The company saw adjusted income increase by 7%, with adjusted earnings-per-share rising by 9% (faster than adjusted income due to net share repurchases).
More details about Pfizer’s recent financial performance can be seen below.

Source: Pfizer Fourth Quarter Investor Presentation, slide 7
Pfizer is shareholder-friendly in the sense that the company provides guidance on a wide variety of financial metrics and actually meets that guidance.
Below, you can see a comparison of Pfizer’s 2016 financial guidance along with the company’s actual reported performance.

Source: Pfizer Fourth Quarter Investor Presentation, slide 9
Pfizer also executed on a variety of non-financial goals during 2016, including the advancement of various drugs through its product pipeline.
Shareholders should be pleased to see that Pfizer returned $12.3 billion to shareholders in 2016 through a healthy combination of dividends and share repurchases.
More specific details about Pfizer’s 2016 progress can be seen below.

Source: Pfizer Fourth Quarter Investor Presentation, slide 11
For 2017, Pfizer is expecting mid-single-digit operational growth and adjusted earnings-per-share growth of 10% at the midpoint. If valuation multiples remain constant, the coming year should be a year of strong returns for Pfizer shareholders.
The company also continues to invest internally.
As a pharmaceutical company, Pfizer’s long-term growth will stagnate unless it devotes a significant portion of capital to research and development.
For 2017, Pfizer is expecting to spend between $7.5 billion and $8.0 billion on research and development, which amounts 13.9%-15.4% of the company’s expected revenues.
More details about Pfizer’s 2017 guidance can be seen below.

Source: Pfizer Fourth Quarter Investor Presentation, slide 10
Pfizer is a strong dividend stock.
The company currently pays a quarterly dividend of $0.32 per share, which is good for a dividend yield of 3.8% based on the current stock price of $33.88. Investors generate nearly twice as much income from an investment in Pfizer as they do from an investment in an S&P 500 index fund.
Pfizer is also attractively valued right now.
The company reported adjusted earnings-per-share of $2.40 for fiscal 2016. The company’s current stock price of $33.88 represents 14.1x multiple of 2016’s earnings.
Like other pharmaceutical companies, Pfizer’s valuation is depressed right now among industry-wide concerns about predatory drug pricing and the potential for government intervention on this front.
If these concerns change, this could result in meaningful valuation expansion for Pfizer’s stock.
If you’re interested in reading more analysis about Pfizer Inc., the following article might be of interest:
- Better Big Pharma Dividend Stock: Pfizer or Teva?
- Pfizer: How A 15% Decline Is A Gift To Income Investors
- Healthcare Dividend Stock Showdown: Johnson & Johnson vs. Pfizer
Baldwin & Lyons, Inc. (BWINB)
Dividend Yield: 4.3%
Adjusted Price-to-Earnings Ratio: 12.9
Percent of Prem Watsa’s Portfolio: 0.8%
Fairfax Financial owns 377,524 shares of Baldwin & Lyons with a market value of $9.5 million. This comprises 0.8% of Prem Watsa’s investment portfolio.
Balwin & Lyons is an insurance company that specializes in marketing and underwriting insurance for the transportation industry. The company is very small, with a market capitalization of $370 million.
The company was founded in 1930, and acts as a holding company for three operating subsidiaries:
- Protective Insurance Company
- Sagamore Insurance Company
- Protective Specialty Insurance Company
In the long run, Baldwin & Lyons has not succeeded in building shareholder value. The company’s stock has remained essentially flat since 2003.
However, current investors might be tempted by the company’s high dividend yield.
Balwin and Lyons currently pays a $0.27 per share quarterly dividend, which is good for a yield of 4.3% based on the company’s current stock price of $24.85.
The company reported net income per share of $1.92 for fiscal 2016, which means that this stock is currently trading at a price-to-earnings ratio of 12.9x.
Despite the company’s high dividend yield and attractive valuation, I would not recommend this stock because of its lack of any meaningful growth over the past decade.
Investors should also keep in mind that Baldwin & Lyons is a small cap stock, and has more inherent risk than its large-cap counterparts. Accordingly, consider these risks before initiating a position in this stock.
Helmerich & Payne, Inc. (HP)
Dividend Yield: 4.5%
Adjusted Price-to-Earnings Ratio: N/A (negative earnings)
Percent of Prem Watsa’s Portfolio: 2.3%
Prem Watsa has purchased 349,974 shares of Helmerich & Payne with a market value of $27.1 million.
Helmerich & Payne is an energy company engaged in contract drilling. The company was founded in 1940 and has a long history of rewarding its shareholders.
Before the onset of the rock-bottom oil prices, Helmerich & Payne had grown its earnings-per-share by more than 20% per year for more than a decade. This is the type of growth you would expect from a small-cap technology company, not an established business in a legacy business like contract drilling.
Although the oil & gas sector has been hammered recently, Helmerich & Payne has navigated this tough operating environment better than many of its peers.
The company has managed to actually grow its rig fleet while many of its peers have been selling assets and securing financing just to stay solvent. The composition of its rig fleet has changed, as well – the company is replacing legacy assets with its high-tech AC Flex Rigs.

Source: Helmerich & Payne Presentation at the Scotia Howard Weil 45th Annual Energy Conference
Helmerich & Payne has actually gained market share since oil prices have dropped off a cliff, leap-frogging many of its competitors.
The company is now a leader in its industry, holding 28% market share. For comparison, its next largest competitor has 16% market share.

Source: Helmerich & Payne Presentation at the Scotia Howard Weil 45th Annual Energy Conference
Helmerich & Payne also has a robust pipeline.
The company has booked a substantial number of deals for fiscal 2017 and fiscal 2018, which should help support this company if oil prices continue to stay low.

Source: Helmerich & Payne Presentation at the Scotia Howard Weil 45th Annual Energy Conference
Helmerich & Payne will also continue to benefit from its solid balance sheet.
Despite the challenges brought on by low oil prices, the company still has the lowest leverage of its peer group. This indicates wise capital allocation and strong expense management from Helmerich & Payne’s management team.

Source: Helmerich & Payne Presentation at the Scotia Howard Weil 45th Annual Energy Conference
Helmerich & Payne is an attractive dividend stock, with a dividend yield well above its peer group.
Helmerich & Payne’s current dividend yield is compared to its major competitors in the following diagram.

Source: Helmerich & Payne Presentation at the Scotia Howard Weil 45th Annual Energy Conference
Helmerich & Payne currently has a fantastic dividend yield of 4.5% based on its annual payout of $2.80 and its current stock price of $61.55.
Valuing this company is difficult. Helmerich & Payne cannot be meaningfully analyzed using the traditional price-to-earnings ratio because the company reported negative earnings for fiscal 2016.
With that said, this company offers an attractive dividend yield and a method to participate in upside to the oil & gas industry if oil prices recover.
“The best thing that happens to us is when a great company gets into temporary trouble… We want to buy them when they’re on the operating table.” – Warren Buffett
Helmerich & Payne’s stock price has declined from a high of $118 to its current level of $61.55. The company will likely regain most (if not all) of this spread if oil prices recover in any meaningful way.
If you’re interested in reading more analysis about Helmerich & Payne, the following article might be of interest:
- Can The Top 10 S&P 500 Dividend Growers Continue Their Rapid Dividend Growth?
- This Is Why Helmerich & Payne Is A Fracking Buy
POSCO (PKX)
Dividend Yield: 11.9%
Adjusted Price-to-Earnings Ratio: N/A
Percent of Prem Watsa’s Portfolio: 0.9%
Prem Watsa has accumulated 191,879 shares of POSCO with a market value of $10 million. With a dividend yield of 11.9%, POSCO is the highest-yielding stock in Fairfax Financial’s investment portfolio.
POSCO is a global steel company with headquarters in Pohang, South Korea.
The company’s original stock issue trades on the Korean Stock Exchange, and investors can purchase an ADR trading on the New York Stock Exchange under the ticker PKX.
POSCO is an unconventional stock for dividend growth investors for two reasons.
First of all, the company does not have a history of raising its dividend payments. This steel manufacturer actually cut its dividend by 20% in 2012 (when it declared an annual dividend of 8,000 KRW, down from 10,000 KRW the year prior).
Investors who purchase the company’s ADRs expose themselves to unnecessary exchange rate risk. The company currently pays an annual dividend of 8,000 KRW, which is worth $7.02 at today’s prices. This stock is priced for a dividend yield of 11.9% at today’s per-share market value of $59.98.
However, this dividend yield will fluctuate with exchange rates and investors real income might actually decrease over a given time period.
The tax implications of investing this ADR are also complicated.
For investors looking for domestic exposure to the steel manufacturing industry, Nucor (NUE) might present a better alternative to POSCO.
Final Thoughts
The portfolios of successful, institutional money managers are great places to find high-quality dividend stocks.
If you found this article helpful or useful, the following Sure Dividend articles may be of interest: