


Spreadsheet data updated daily
Retirees face unique challenges when it comes to investing.
First among those is the desire to generate monthly income that remains relatively stable each month. Said another way, retirees aim to create a passive income stream that is very consistent in nature.
One way to achieve this is by creating a portfolio of dividend stocks that generates the same dividend income each month. This requires deliberately allocating a particular amount of capital to securities whose dividends are paid in each calendar month.
With this in mind, we’ve compiled a database of all stocks that pay dividends in February. You can download this list below:
The list of stocks that pay dividends in February available for download above contains the following metrics for each stock in the database:
- Name
- Ticker
- Stock price
- Dividend yield
- Market capitalization
- P/E Ratio
- Payout Ratio
- Beta
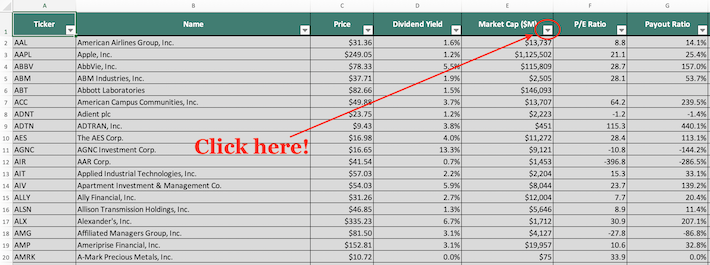
Additionally, you can find and sort February paying dividend stocks using the table below.
| AAL | American Airlines Group, Inc. | 31.36 | 1.6 | 13,737.5 | 8.8 | 14.1 |
| AAPL | Apple, Inc. | 249.05 | 1.2 | 1,125,501.8 | 21.1 | 25.4 |
| ABBV | AbbVie, Inc. | 78.33 | 5.5 | 115,809.3 | 28.7 | 157.0 |
| ABM | ABM Industries, Inc. | 37.71 | 1.9 | 2,504.5 | 28.1 | 53.7 |
| ABT | Abbott Laboratories | 82.66 | 1.5 | 146,093.3 | ||
| ACC | American Campus Communities, Inc. | 49.88 | 3.7 | 13,707.2 | 64.2 | 239.5 |
| ADNT | Adient plc | 23.75 | 1.2 | 2,223.5 | -1.2 | -1.4 |
| ADTN | ADTRAN, Inc. | 9.43 | 3.8 | 451.0 | 115.3 | 440.1 |
| AES | The AES Corp. | 16.98 | 4.0 | 11,272.2 | 28.4 | 113.1 |
| AGNC | AGNC Investment Corp. | 16.65 | 13.3 | 9,121.2 | -10.8 | -144.2 |
| AIR | AAR Corp. | 41.54 | 0.7 | 1,452.7 | -396.8 | -286.5 |
| AIT | Applied Industrial Technologies, Inc. | 57.03 | 2.2 | 2,204.3 | 15.3 | 33.1 |
| AIV | Apartment Investment & Management Co. | 54.03 | 5.9 | 8,044.2 | 23.7 | 139.2 |
| ALLY | Ally Financial, Inc. | 31.26 | 2.7 | 12,004.3 | 7.7 | 20.4 |
| ALSN | Allison Transmission Holdings, Inc. | 46.85 | 1.3 | 5,645.8 | 8.9 | 11.4 |
| ALX | Alexander's, Inc. | 335.23 | 6.7 | 1,712.0 | 30.9 | 207.1 |
| AMG | Affiliated Managers Group, Inc. | 81.50 | 3.1 | 4,127.1 | -27.8 | -86.8 |
| AMP | Ameriprise Financial, Inc. | 152.81 | 3.1 | 19,957.0 | 10.6 | 32.8 |
| AMRK | A-Mark Precious Metals, Inc. | 10.72 | 0.0 | 75.4 | 33.9 | 0.0 |
| AMSWA | American Software, Inc. | 15.83 | 3.5 | 493.4 | 74.9 | 261.8 |
| AMTD | TD Ameritrade Holding Corp. | 38.88 | 3.9 | 21,436.3 | 9.8 | 37.8 |
| ANCX | Access National Corporation | 0.00 | 0.0 | 0.0 | ||
| ANDX | Andeavor Logistics LP | 32.17 | 9.6 | 7,901.9 | 12.6 | 121.5 |
| AON | Aon Plc | 187.79 | 1.1 | 44,288.8 | 31.7 | 35.7 |
| AOS | A. O. Smith Corp. | 51.35 | 2.2 | 7,104.3 | 20.5 | 44.6 |
| APA | Apache Corp. | 21.73 | 4.6 | 8,169.6 | -11.6 | -53.5 |
| APAM | Artisan Partners Asset Management, Inc. | 27.32 | 12.2 | 2,125.7 | 11.0 | 134.7 |
| APD | Air Products & Chemicals, Inc. | 211.48 | 2.2 | 46,600.7 | 27.2 | 59.0 |
| APLE | Apple Hospitality REIT, Inc. | 16.38 | 7.9 | 3,667.0 | 18.9 | 149.9 |
| APO | Apollo Global Management, Inc. | 41.25 | 4.8 | 16,614.0 | 35.0 | 167.8 |
| APOG | Apogee Enterprises, Inc. | 37.92 | 1.8 | 1,007.0 | 23.0 | 42.4 |
| ARCB | ArcBest Corp. | 30.73 | 1.0 | 783.7 | 9.3 | 9.6 |
| ARNC | Arconic, Inc. | 27.66 | 0.7 | 12,175.6 | 30.6 | 19.9 |
| AROC | Archrock, Inc. | 9.89 | 6.9 | 1,503.0 | 24.0 | 166.8 |
| ARR | ARMOUR Residential REIT, Inc. | 16.62 | 14.3 | 978.8 | -1.4 | -20.6 |
| ARTNA | Artesian Resources Corp. | 36.75 | 3.3 | 341.0 | 23.9 | 79.7 |
| ASRV | AmeriServ Financial, Inc. | 4.13 | 2.8 | 70.8 | 9.9 | 27.6 |
| ATLO | Ames National Corp. | 27.85 | 4.2 | 256.9 | 15.1 | 63.8 |
| ATR | AptarGroup, Inc. | 118.20 | 2.4 | 7,569.7 | 34.4 | 82.6 |
| AVAL | Grupo Aval Acciones y Valores SA | 7.99 | 6.1 | 2,842.9 | 8.7 | 52.7 |
| AXP | American Express Co. | 118.58 | 1.3 | 97,030.6 | 14.3 | 19.3 |
| AYI | Acuity Brands, Inc. | 126.64 | 0.4 | 5,089.1 | 15.2 | 6.2 |
| AZZ | AZZ, Inc. | 38.77 | 1.8 | 1,013.9 | 17.8 | 31.3 |
| BAH | Booz Allen Hamilton Holding Corp. | 68.23 | 1.3 | 9,567.1 | 22.4 | 28.9 |
| BBD | Banco Bradesco SA | 9.15 | 6.1 | 36,784.4 | 13.5 | 82.2 |
| BBDO | Banco Bradesco SA | 8.44 | 14.1 | 34,284.0 | 12.5 | 176.4 |
| BCBP | BCB Bancorp, Inc. | 12.98 | 5.4 | 213.9 | 10.6 | 57.0 |
| BELFB | Bel Fuse, Inc. | 14.87 | 1.9 | 183.2 | 9.1 | 17.1 |
| BFIN | BankFinancial Corp. | 12.56 | 3.2 | 193.1 | 13.0 | 41.3 |
| BGSF | BG Staffing, Inc. | 19.28 | 6.2 | 197.3 | 12.1 | 75.3 |
| BK | The Bank of New York Mellon Corp. | 46.89 | 3.1 | 43,241.9 | 12.1 | 37.7 |
| BLX | Banco Latinoamericano de Comercio Exterior SA | 20.87 | 9.2 | 778.3 | 9.7 | 89.9 |
| BMO | Bank of Montreal | 75.35 | 6.7 | 48,039.8 | 10.5 | 70.2 |
| BMRC | Bank of Marin Bancorp | 44.00 | 2.6 | 598.8 | 17.3 | 45.2 |
| BMY | Bristol-Myers Squibb Co. | 55.59 | 3.0 | 90,932.5 | 14.6 | 43.0 |
| BNCL | 0.00 | 0.0 | 0.0 | |||
| BOKF | BOK Financial Corp. | 78.51 | 2.5 | 5,563.1 | 11.2 | 28.6 |
| BPFH | Boston Private Financial Holdings, Inc. | 11.38 | 5.3 | 954.8 | 9.9 | 52.3 |
| BRO | Brown & Brown, Inc. | 35.86 | 0.9 | 10,086.5 | 26.0 | 23.6 |
| BSET | Bassett Furniture Industries, Inc. | 15.12 | 4.1 | 152.9 | 30.7 | 127.0 |
| BSMX | Banco Santander Mexico SA Institucion de Banca Multiple | 6.98 | 5.3 | 4,638.5 | 8.8 | 46.9 |
| BSRR | Sierra Bancorp | 27.50 | 3.3 | 420.3 | 12.2 | 39.9 |
| BT | BT Group Plc | 10.89 | 8.5 | 21,503.7 | 7.6 | 64.8 |
| BTI | British American Tobacco plc | 34.88 | 9.3 | 79,745.2 | 10.0 | 93.6 |
| BUSE | First Busey Corp. | 26.21 | 3.2 | 1,446.7 | 14.0 | 44.7 |
| C | Citigroup, Inc. | 73.59 | 3.2 | 160,661.7 | 9.7 | 31.3 |
| CASY | Casey's General Stores, Inc. | 166.02 | 0.9 | 6,106.7 | 27.8 | 25.3 |
| CAT | Caterpillar, Inc. | 140.06 | 2.7 | 78,796.2 | 13.2 | 35.6 |
| CBRL | Cracker Barrel Old Country Store, Inc. | 157.62 | 5.1 | 3,792.3 | 17.0 | 87.2 |
| CDR | Cedar Realty Trust, Inc. | 3.34 | 7.5 | 297.4 | 36.8 | 275.6 |
| CF | CF Industries Holdings, Inc. | 45.83 | 3.3 | 10,005.9 | 22.6 | 74.1 |
| CFFN | Capitol Federal Financial, Inc. | 14.42 | 7.4 | 2,039.5 | 20.9 | 154.3 |
| CFG | Citizens Financial Group, Inc. (Rhode Island) | 36.17 | 7.5 | 16,056.4 | 9.6 | 72.3 |
| CG | The Carlyle Group LP | 27.50 | 5.3 | 9,384.2 | 10.8 | 57.5 |
| CHFN | Charter Financial Corporation | 0.00 | 0.0 | 0.0 | ||
| CIT | CIT Group, Inc. | 44.24 | 3.5 | 4,207.5 | 9.2 | 32.1 |
| CIVB | Civista Bancshares, Inc. | 21.70 | 1.9 | 335.8 | 10.3 | 19.9 |
| CL | Colgate-Palmolive Co. | 67.35 | 2.5 | 57,786.7 | 25.6 | 65.0 |
| CLB | Core Laboratories NV | 45.17 | 4.9 | 2,004.4 | 23.9 | 116.3 |
| CLCT | Collectors Universe, Inc. | 29.42 | 3.0 | 264.3 | 26.4 | 78.4 |
| CLDT | Chatham Lodging Trust | 17.87 | 8.0 | 838.5 | 33.3 | 266.3 |
| CLX | The Clorox Co. | 150.77 | 5.4 | 18,920.7 | 23.5 | 127.3 |
| CMCO | Columbus McKinnon Corp. | 38.36 | 0.7 | 906.1 | 16.8 | 12.3 |
| CMRE | Costamare Inc. | 7.90 | 5.1 | 933.6 | 17.7 | 89.6 |
| CMS | CMS Energy Corp. | 62.51 | 3.0 | 17,743.0 | 28.5 | 86.1 |
| CMTL | Comtech Telecommunications Corp. | 33.23 | 1.2 | 800.8 | 32.0 | 38.8 |
| CNBKA | Century Bancorp, Inc. (Massachusetts) | 86.36 | 0.7 | 474.9 | ||
| CNOB | ConnectOne Bancorp, Inc. | 24.46 | 1.4 | 867.9 | 11.9 | 16.7 |
| CNSL | Consolidated Communications Holdings, Inc. | 3.59 | 21.6 | 258.8 | -5.7 | -123.7 |
| COBZ | CoBiz Financial Inc. | 0.00 | 0.0 | 0.0 | ||
| COF | Capital One Financial Corp. | 95.17 | 1.7 | 44,320.7 | 8.4 | 14.1 |
| COG | Cabot Oil & Gas Corp. | 18.11 | 2.3 | 7,387.5 | 9.5 | 22.0 |
| COKE | Coca-Cola Consolidated, Inc. | 271.81 | 0.4 | 2,547.3 | 379.5 | 139.6 |
| COLB | Columbia Banking System, Inc. | 39.05 | 6.7 | 2,842.4 | 14.7 | 98.8 |
| COO | The Cooper Cos., Inc. | 284.02 | 0.0 | 14,080.0 | 31.4 | 0.7 |
| CORR | CorEnergy Infrastructure Trust, Inc. | 47.32 | 7.9 | 640.3 | 17.7 | 140.4 |
| CPG | Crescent Point Energy Corp. | 3.94 | 3.0 | 2,166.9 | -1.3 | -4.0 |
| CRT | Cross Timbers Royalty Trust | 8.77 | 12.5 | 52.6 | 7.3 | 92.1 |
| CSB | VictoryShares US Small Cap High Div Volatility Wtd ETF | 45.92 | 0.0 | 0.0 | ||
| CTO | Consolidated-Tomoka Land Co. | 62.93 | 0.8 | 310.2 | 10.8 | 8.9 |
| CTS | CTS Corp. | 26.97 | 0.6 | 879.3 | 20.3 | 12.0 |
| CTSH | Cognizant Technology Solutions Corp. | 60.67 | 1.3 | 33,507.5 | 16.8 | 22.1 |
| CVCY | Central Valley Community Bancorp | 20.59 | 2.5 | 273.9 | 12.5 | 31.7 |
| CVLY | Codorus Valley Bancorp, Inc. | 21.46 | 3.0 | 212.1 | 11.6 | 34.7 |
| CVS | CVS Health Corp. | 65.88 | 3.0 | 85,676.9 | 18.5 | 56.0 |
| CWBC | Community West Bancshares | 9.97 | 4.3 | 84.4 | 12.9 | 55.5 |
| CWT | California Water Service Group | 53.90 | 1.4 | 2,594.7 | 43.8 | 63.5 |
| CZFC | Citizens First Corp. | 25.68 | 0.8 | 65.4 | 13.4 | 11.0 |
| CZNC | Citizens & Northern Corp. | 25.76 | 4.6 | 353.0 | 16.9 | 77.3 |
| DCOM | Dime Community Bancshares, Inc. | 18.94 | 3.7 | 681.1 | 16.4 | 60.5 |
| DDS | Dillard's, Inc. | 74.07 | 0.6 | 1,853.3 | 15.2 | 9.2 |
| DE | Deere & Co. | 173.35 | 1.8 | 54,583.2 | 16.6 | 29.2 |
| DGICA | Donegal Group, Inc. | 14.34 | 5.0 | 409.7 | 28.6 | 143.5 |
| DHT | DHT Holdings, Inc. | 7.51 | 2.9 | 1,085.2 | 110.4 | 318.9 |
| DLB | Dolby Laboratories, Inc. | 64.24 | 1.2 | 6,516.9 | 25.2 | 29.8 |
| DLPH | Delphi Technologies Plc | 14.50 | 1.2 | 1,263.1 | 5.9 | 6.9 |
| DRAD | Digirad Corp. | 3.91 | 14.1 | 7.9 | -1.3 | -18.4 |
| DRE | Duke Realty Corp. | 35.25 | 2.4 | 12,851.7 | 54.7 | 133.5 |
| DRI | Darden Restaurants, Inc. | 111.35 | 2.9 | 13,651.7 | 19.1 | 56.0 |
| EBF | Ennis, Inc. | 19.82 | 4.6 | 514.0 | 13.7 | 62.5 |
| ECC | Eagle Point Credit Co., Inc. | 15.53 | 18.0 | 377.6 | -14.1 | -254.3 |
| EDR | Endeavor Group Holdings, Inc. | 0.00 | 0.0 | 0.0 | ||
| EEI | Ecology & Environment, Inc. | 15.06 | 2.7 | 65.4 | -38.3 | -101.7 |
| ENIA | Enel Américas SA | 9.65 | 4.2 | 14,684.7 | 8.4 | 35.5 |
| ENIC | Enel Chile SA | 4.33 | 5.1 | 6,073.6 | 13.8 | 71.1 |
| EOCC | Enel Generación Chile S.A. | 0.00 | 0.0 | 0.0 | ||
| EPR | EPR Properties | 78.29 | 6.2 | 6,071.9 | 23.1 | 142.7 |
| ERF | Enerplus Corp. | 6.16 | 2.1 | 1,420.7 | 4.4 | 9.4 |
| ERJ | Embraer SA | 17.73 | 0.1 | 3,278.3 | -41.9 | -2.5 |
| EV | Eaton Vance Corp. | 45.88 | 3.9 | 5,205.8 | 12.9 | 49.8 |
| EWBC | East West Bancorp, Inc. | 43.41 | 2.9 | 6,404.1 | 9.6 | 28.0 |
| FAST | Fastenal Co. | 36.83 | 3.5 | 21,123.0 | 27.0 | 95.3 |
| FBIZ | First Business Financial Services, Inc. | 24.44 | 4.9 | 211.1 | 9.9 | 48.2 |
| FBMS | The First Bancshares, Inc. (Mississippi) | 33.02 | 1.1 | 565.5 | 13.9 | 15.1 |
| FCBC | First Community Bancshares, Inc. (Virginia) | 32.45 | 3.6 | 505.6 | 13.3 | 48.1 |
| FCCO | First Community Corp. (South Carolina) | 19.18 | 2.8 | 142.1 | 13.2 | 37.2 |
| FCCY | 1st Constitution Bancorp | 19.00 | 2.0 | 165.0 | 11.9 | 23.5 |
| FCF | First Commonwealth Financial Corp. (Pennsylvania) | 13.90 | 2.8 | 1,374.1 | 13.2 | 36.9 |
| FCFS | FirstCash, Inc. | 86.30 | 1.5 | 3,707.7 | 23.6 | 34.8 |
| FDEF | First Defiance Financial Corp. | 30.45 | 3.2 | 600.7 | 12.4 | 39.2 |
| FELE | Franklin Electric Co., Inc. | 52.15 | 1.3 | 2,416.5 | 25.4 | 34.1 |
| FIBK | First Interstate BancSystem, Inc. (Montana) | 42.66 | 2.8 | 2,787.2 | 15.8 | 44.6 |
| FII | Federated Investors, Inc. | 30.91 | 4.4 | 3,131.0 | 12.3 | 53.5 |
| FL | Foot Locker, Inc. | 44.31 | 3.3 | 4,746.1 | 9.6 | 32.2 |
| FRC | First Republic Bank (San Francisco, California) | 107.42 | 0.7 | 18,070.4 | 20.8 | 14.5 |
| FRD | Friedman Industries, Inc. | 6.70 | 2.4 | 46.9 | 27.8 | 66.4 |
| FSBW | FS Bancorp, Inc. | 56.29 | 1.4 | 252.1 | 8.3 | 11.7 |
| FSP | Franklin Street Properties Corp. | 8.60 | 4.2 | 925.4 | 80.5 | 335.9 |
| FUL | H.B. Fuller Co. | 49.68 | 1.3 | 2,532.8 | 18.0 | 23.1 |
| GABC | German American Bancorp, Inc. | 33.11 | 2.0 | 882.7 | 15.0 | 29.9 |
| GBX | Greenbrier Cos., Inc. | 30.46 | 4.1 | 986.2 | 14.0 | 57.5 |
| GCBC | Greene County Bancorp, Inc. | 26.40 | 2.0 | 225.4 | 12.5 | 24.7 |
| GD | General Dynamics Corp. | 174.93 | 2.3 | 50,608.3 | 15.0 | 34.2 |
| GEO | The GEO Group, Inc. | 15.54 | 12.4 | 1,884.3 | 11.9 | 147.4 |
| GFA | Gafisa S.A. | 0.00 | 0.0 | 0.0 | ||
| GGG | Graco, Inc. | 46.52 | 1.4 | 7,758.6 | 23.2 | 32.0 |
| GHC | Graham Holdings Co. | 649.66 | 0.9 | 3,452.9 | 10.8 | 9.2 |
| GHM | Graham Corp. | 20.65 | 2.0 | 204.0 | -79.7 | -158.3 |
| GIS | General Mills, Inc. | 50.00 | 3.9 | 30,219.7 | 16.1 | 62.9 |
| GLBZ | Glen Burnie Bancorp | 10.66 | 3.8 | 30.1 | 23.0 | 86.4 |
| GLT | P.H. Glatfelter Co. | 15.72 | 3.3 | 694.4 | -4.2 | -13.8 |
| GNL | Global Net Lease, Inc. | 19.41 | 11.0 | 1,639.9 | 159.5 | 1,750.2 |
| GOOD | Gladstone Commercial Corp. | 22.59 | 7.7 | 719.8 | 424.6 | 3,289.5 |
| GORO | Gold Resource Corp. | 3.96 | 0.6 | 259.7 | 89.2 | 52.5 |
| GOV | Government Properties Income Trust | 0.00 | 0.0 | 0.0 | ||
| GROW | U.S. Global Investors, Inc. | 2.05 | 1.7 | 31.0 | -9.2 | -15.6 |
| GWB | Great Western Bancorp, Inc. (South Dakota) | 36.27 | 3.9 | 2,041.4 | ||
| GWRS | Global Water Resources, Inc. | 12.15 | 2.4 | 261.7 | 132.8 | 312.7 |
| HAFC | Hanmi Financial Corp. | 18.75 | 6.4 | 584.5 | 14.1 | 90.1 |
| HAS | Hasbro, Inc. | 96.64 | 3.4 | 12,201.1 | 46.7 | 159.3 |
| HBCP | Home Bancorp, Inc. | 39.11 | 2.1 | 367.9 | 11.6 | 24.3 |
| HCAP | Harvest Capital Credit Corp. | 9.85 | 10.2 | 59.8 | 27.0 | 275.8 |
| HCFT | Hunt Companies Finance Trust, Inc. | 3.33 | 8.4 | 78.9 | 35.6 | 299.1 |
| HFWA | Heritage Financial Corp. (Washington) | 27.99 | 4.0 | 1,032.3 | 15.4 | 61.1 |
| HNRG | Hallador Energy Co. | 3.54 | 5.6 | 107.1 | 12.0 | 67.6 |
| HPT | Hospitality Properties Trust | 25.28 | 8.4 | 4,157.3 | 17.1 | 144.1 |
| HRL | Hormel Foods Corp. | 40.49 | 2.1 | 21,620.4 | 22.0 | 45.6 |
| HSII | Heidrick & Struggles International, Inc. | 27.81 | 2.1 | 532.1 | 11.2 | 23.3 |
| HTBK | Heritage Commerce Corp. | 11.85 | 5.0 | 515.5 | 10.7 | 53.0 |
| HXL | Hexcel Corp. | 74.05 | 1.1 | 6,255.8 | 21.1 | 22.5 |
| IBCP | Independent Bank Corp. (Michigan) | 22.65 | 3.8 | 509.2 | 12.4 | 47.5 |
| IBTX | Independent Bank Group, Inc. | 54.64 | 2.1 | 2,346.9 | 12.4 | 25.9 |
| IDA | IDACORP, Inc. | 107.04 | 3.0 | 5,382.4 | 24.1 | 71.9 |
| INN | Summit Hotel Properties, Inc. | 12.15 | 5.9 | 1,277.3 | 14.0 | 82.7 |
| ISBC | Investors Bancorp, Inc. (New Jersey) | 12.46 | 4.4 | 3,423.5 | 18.4 | 81.0 |
| ISDR | Issuer Direct Corp. | 10.57 | 0.5 | 40.8 | 71.1 | 33.6 |
| ITUB | Itaú Unibanco Holding SA | 9.19 | 8.1 | 44,356.7 | 13.2 | 106.8 |
| JBHT | J.B. Hunt Transport Services, Inc. | 116.79 | 1.1 | 12,449.8 | ||
| JHX | James Hardie Industries Plc | 17.50 | 2.0 | 7,991.4 | 34.4 | 69.3 |
| JMP | JMP Group LLC | 3.35 | 6.6 | 64.7 | -95.4 | -626.8 |
| KAI | Kadant, Inc. | 87.74 | 1.0 | 988.0 | 15.2 | 15.7 |
| KALU | Kaiser Aluminum Corp. | 108.63 | 2.2 | 1,727.3 | 18.2 | 40.2 |
| KBH | KB Home | 35.58 | 1.6 | 3,136.4 | 13.0 | 20.9 |
| KMI | Kinder Morgan, Inc. | 20.18 | 5.7 | 45,707.1 | 22.2 | 126.7 |
| KMT | Kennametal, Inc. | 32.64 | 2.4 | 2,714.3 | 11.1 | 27.1 |
| LAND | Gladstone Land Corp. | 11.96 | 5.2 | 248.9 | ||
| LAZ | Lazard Ltd. | 38.54 | 5.6 | 4,119.2 | 11.6 | 65.1 |
| LBAI | Lakeland Bancorp, Inc. | 16.30 | 3.7 | 823.0 | 12.1 | 44.9 |
| LCUT | Lifetime Brands, Inc. | 8.07 | 2.6 | 171.5 | -524.0 | -1,379.9 |
| LEN | Lennar Corp. | 60.27 | 0.3 | 19,142.9 | 9.9 | 2.6 |
| LION | Fidelity Southern Corp. | 30.97 | 1.5 | 856.5 | 22.1 | 34.3 |
| LKFN | Lakeland Financial Corp. (Indiana) | 46.40 | 2.5 | 1,180.6 | 13.7 | 34.3 |
| LNC | Lincoln National Corp. | 62.18 | 2.4 | 12,448.0 | 8.6 | 20.6 |
| LNN | Lindsay Corp. | 93.00 | 1.3 | 1,003.1 | 178.1 | 237.5 |
| LNT | Alliant Energy Corp. | 52.73 | 2.7 | 12,524.5 | 24.4 | 65.7 |
| LOGM | LogMeIn, Inc. | 65.50 | 2.4 | 3,222.8 | 224.3 | 543.6 |
| LOW | Lowe's Cos., Inc. | 111.64 | 1.8 | 86,163.6 | 34.8 | 64.3 |
| LTC | LTC Properties, Inc. | 51.16 | 5.2 | 2,033.7 | 19.1 | 99.1 |
| LTXB | LegacyTexas Financial Group, Inc. | 44.61 | 1.7 | 2,213.0 | 13.6 | 22.6 |
| LYTS | LSI Industries, Inc. | 5.21 | 3.8 | 136.6 | -8.3 | -31.9 |
| MA | Mastercard, Inc. | 275.93 | 0.6 | 279,947.2 | 42.3 | 25.3 |
| MAIN | Main Street Capital Corp. | 43.10 | 7.8 | 2,721.1 | 16.8 | 131.7 |
| MAS | Masco Corp. | 44.56 | 1.1 | 12,898.2 | 18.2 | 20.2 |
| MATW | Matthews International Corp. | 38.20 | 2.1 | 1,202.9 | 19.3 | 40.5 |
| MBTF | MBT Financial Corp. | 9.84 | 4.2 | 226.7 | 22.5 | 93.9 |
| MCBC | Macatawa Bank Corp. | 10.45 | 5.4 | 355.9 | 11.5 | 61.8 |
| MDC | M.D.C. Holdings, Inc. | 44.09 | 2.7 | 2,714.2 | 13.3 | 36.4 |
| MED | Medifast, Inc. | 107.80 | 2.8 | 1,275.9 | 17.9 | 49.8 |
| MKTX | MarketAxess Holdings, Inc. | 348.87 | 0.7 | 13,179.3 | 64.5 | 45.4 |
| MMC | Marsh & McLennan Cos., Inc. | 97.87 | 1.8 | 49,552.7 | 33.4 | 59.4 |
| MMS | MAXIMUS, Inc. | 74.85 | 1.7 | 4,776.3 | 21.3 | 36.4 |
| MN | Manning & Napier, Inc. | 1.69 | 5.9 | 26.4 | 11.1 | 65.9 |
| MRLN | Marlin Business Services Corp. | 24.20 | 2.3 | 296.2 | 12.7 | 29.4 |
| MS | Morgan Stanley | 46.84 | 3.4 | 76,068.2 | 9.9 | 33.7 |
| MSB | Mesabi Trust | 24.26 | 16.9 | 334.6 | 8.1 | 136.9 |
| MSBI | Midland States Bancorp, Inc. | 26.81 | 3.5 | 652.5 | 11.0 | 38.8 |
| MWA | Mueller Water Products, Inc. | 11.69 | 3.5 | 1,839.5 | 38.0 | 134.1 |
| NBL | Noble Energy, Inc. | 20.21 | 2.9 | 9,665.5 | -10.5 | -30.1 |
| NBN | Northeast Bank (Maine) | 22.25 | 0.0 | 201.2 | 14.5 | 0.7 |
| NDRO | Enduro Royalty Trust | 0.00 | 0.0 | 0.0 | ||
| NFBK | Northfield Bancorp, Inc. (New Jersey) | 16.92 | 3.1 | 833.4 | 19.7 | 61.6 |
| NI | NiSource, Inc. | 27.45 | 3.6 | 10,248.4 | 90.0 | 326.2 |
| NNN | National Retail Properties, Inc. | 57.85 | 4.4 | 9,929.2 | 40.6 | 177.5 |
| NRG | NRG Energy, Inc. | 40.38 | 0.4 | 10,215.7 | 22.2 | 8.2 |
| NRT | North European Oil Royalty Trust | 6.30 | 12.9 | 57.9 | 7.8 | 100.8 |
| NUE | Nucor Corp. | 54.73 | 2.9 | 16,591.8 | 9.3 | 27.3 |
| NVEC | NVE Corp. | 64.39 | 6.2 | 312.0 | 22.8 | 141.4 |
| NWBI | Northwest Bancshares, Inc. (Pennsylvania) | 17.20 | 5.2 | 1,834.5 | 16.1 | 83.3 |
| NWFL | Norwood Financial Corp. | 31.11 | 3.1 | 196.0 | 14.0 | 43.3 |
| NWN | Northwest Natural Holding Co. | 69.78 | 4.1 | 2,124.3 | 29.5 | 120.8 |
| NYCB | New York Community Bancorp, Inc. | 13.48 | 5.0 | 6,300.0 | 17.5 | 88.4 |
| O | Realty Income Corp. | 80.88 | 3.6 | 25,738.3 | 61.7 | 223.2 |
| OAK | Oaktree Capital Group LLC | 51.52 | 4.9 | 3,907.4 | 17.1 | 83.0 |
| OCFC | OceanFirst Financial Corp. | 24.28 | 5.6 | 1,244.1 | 13.1 | 73.2 |
| OFED | Oconee Federal Financial Corp. | 22.35 | 3.5 | 129.2 | 33.8 | 118.7 |
| OHI | Omega Healthcare Investors, Inc. | 43.69 | 7.6 | 9,537.1 | 34.2 | 259.3 |
| OPB | Opus Bank | 24.77 | 3.5 | 893.3 | 26.2 | 93.1 |
| OPY | Oppenheimer Holdings, Inc. | 27.31 | 2.1 | 349.5 | 9.7 | 20.2 |
| ORC | Orchid Island Capital, Inc. | 5.61 | 18.5 | 353.8 | -15.4 | -285.4 |
| ORIT | Oritani Financial Corp. | 19.09 | 7.0 | 861.0 | 16.4 | 114.4 |
| ORRF | Orrstown Financial Services, Inc. | 22.05 | 2.7 | 246.4 | 16.2 | 44.2 |
| OSBC | Old Second Bancorp, Inc. | 12.45 | 0.3 | 372.3 | 9.6 | 3.1 |
| OSK | Oshkosh Corp. | 83.15 | 1.3 | 5,684.3 | 10.1 | 13.2 |
| OVBC | Ohio Valley Banc Corp. | 35.70 | 2.4 | 170.2 | 16.5 | 38.9 |
| OVLY | Oak Valley Bancorp | 16.57 | 1.6 | 136.1 | 10.9 | 17.8 |
| OXM | Oxford Industries, Inc. | 68.85 | 2.1 | 1,185.1 | 16.4 | 34.3 |
| PACW | PacWest Bancorp | 37.82 | 6.3 | 4,532.0 | 9.8 | 62.4 |
| PAYX | Paychex, Inc. | 84.42 | 3.5 | 30,217.6 | 28.7 | 101.5 |
| PBA | Pembina Pipeline Corp. | 35.45 | 6.6 | 18,132.7 | 15.4 | 101.8 |
| PBCT | People's United Financial, Inc. | 17.00 | 5.2 | 6,673.7 | 12.9 | 66.9 |
| PBHC | Pathfinder Bancorp, Inc. | 13.40 | 1.8 | 63.1 | 18.4 | 33.0 |
| PBT | Permian Basin Royalty Trust | 4.05 | 12.3 | 188.8 | 8.2 | 100.8 |
| PCTI | PCTEL, Inc. | 7.25 | 3.0 | 134.0 | -12.3 | -37.4 |
| PEBO | Peoples Bancorp, Inc. (Ohio) | 32.77 | 4.9 | 678.2 | 12.7 | 62.9 |
| PER | SandRidge Permian Trust | 1.66 | 26.7 | 87.2 | 4.0 | 107.8 |
| PETS | PetMed Express, Inc. | 25.77 | 5.2 | 519.9 | 19.8 | 103.8 |
| PFLT | PennantPark Floating Rate Capital Ltd. | 11.51 | 9.9 | 446.3 | 29.6 | 293.6 |
| PFS | Provident Financial Services, Inc. | 25.17 | 8.0 | 1,655.2 | 13.3 | 106.9 |
| PG | Procter & Gamble Co. | 123.48 | 2.4 | 307,935.7 | 76.7 | 183.5 |
| PGC | Peapack-Gladstone Financial Corp. | 28.90 | 0.9 | 549.1 | 12.2 | 10.5 |
| PGR | Progressive Corp. | 68.82 | 4.1 | 40,232.2 | ||
| PKE | Park Aerospace Corp. | 17.03 | 27.3 | 349.4 | 34.7 | 948.2 |
| PKI | PerkinElmer, Inc. (United States) | 87.38 | 0.4 | 9,705.8 | 38.3 | 15.3 |
| PME | Pingtan Marine Enterprise, Ltd. | 2.02 | 0.5 | 159.7 | 13.0 | 6.4 |
| PNC | The PNC Financial Services Group, Inc. | 147.77 | 2.8 | 64,871.0 | ||
| PNFP | Pinnacle Financial Partners, Inc. | 60.71 | 1.3 | 4,656.5 | 11.6 | 15.3 |
| PNM | PNM Resources, Inc. | 50.62 | 2.8 | 4,034.5 | -162.5 | -457.1 |
| PNR | Pentair Plc | 41.55 | 1.7 | 6,984.3 | 20.2 | 35.0 |
| PSMT | PriceSmart, Inc. | 71.81 | 1.0 | 2,183.5 | 30.6 | 30.0 |
| PUB | People's Utah Bancorp | 29.34 | 2.0 | 553.2 | 12.7 | 26.0 |
| PZZA | Papa John's International, Inc. | 58.25 | 1.6 | 1,842.3 | -71.2 | -110.5 |
| RELL | Richardson Electronics Ltd. | 5.75 | 5.2 | 75.5 | -9.7 | -50.7 |
| RGCO | RGC Resources, Inc. | 29.51 | 2.2 | 238.0 | 26.5 | 59.3 |
| RMR | The RMR Group, Inc. | 47.71 | 3.0 | 1,490.3 | 10.4 | 31.2 |
| ROYT | Pacific Coast Oil Trust | 1.32 | 19.3 | 50.9 | 4.0 | 78.0 |
| RTN | Raytheon Co. | 211.61 | 1.7 | 58,928.9 | 18.1 | 31.6 |
| RY | Royal Bank of Canada | 81.23 | 5.0 | 116,442.4 | 12.2 | 61.3 |
| SAFM | Sanderson Farms, Inc. | 153.72 | 0.8 | 3,449.4 | 99.6 | 81.9 |
| SAL | Salisbury Bancorp, Inc. | 38.50 | 5.8 | 108.7 | 10.1 | 59.0 |
| SAN | Banco Santander SA | 4.37 | 5.8 | 72,567.6 | 9.3 | 54.1 |
| SASR | Sandy Spring Bancorp, Inc. | 34.77 | 3.3 | 1,239.1 | 10.9 | 36.5 |
| SBBX | SB One Bancorp | 22.15 | 1.8 | 208.7 | 10.4 | 18.6 |
| SBR | Sabine Royalty Trust | 38.15 | 9.5 | 556.2 | 11.1 | 104.9 |
| SBRA | Sabra Health Care REIT, Inc. | 23.63 | 7.6 | 4,478.2 | 207.3 | 1,578.9 |
| SBUX | Starbucks Corp. | 83.60 | 1.7 | 100,069.2 | 29.2 | 50.3 |
| SC | Santander Consumer USA Holdings, Inc. | 25.24 | 3.3 | 8,725.9 | 9.4 | 30.5 |
| SCCO | Southern Copper Corp. | 36.19 | 6.7 | 28,147.1 | 19.0 | 127.5 |
| SCHN | Schnitzer Steel Industries, Inc. | 21.29 | 3.5 | 576.0 | 10.4 | 36.1 |
| SCHW | The Charles Schwab Corp. | 41.48 | 2.0 | 54,221.8 | 15.3 | 29.8 |
| SDR | Sandridge Mississippian Trust II | 0.23 | 72.0 | 11.5 | 1.4 | 97.3 |
| SDT | Sandridge Mississippian Trust I | 0.36 | 45.5 | 10.1 | 2.1 | 94.3 |
| SGC | Superior Group of Cos., Inc. | 14.70 | 2.7 | 224.0 | 16.1 | 43.8 |
| SHBI | Shore Bancshares, Inc. | 15.90 | 2.5 | 203.2 | 8.4 | 20.5 |
| SHLM | A. Schulman, Inc. | 0.00 | 0.0 | 0.0 | ||
| SIFI | SI Financial Group, Inc. | 14.86 | 1.2 | 178.8 | 16.4 | 19.9 |
| SIMO | Silicon Motion Technology Corp. | 39.50 | 6.5 | 1,463.0 | 17.9 | 116.1 |
| SIR | Select Income REIT | 0.00 | 0.0 | 0.0 | ||
| SIRI | Sirius XM Holdings, Inc. | 6.46 | 1.0 | 28,745.8 | 28.1 | 26.8 |
| SJR | Shaw Communications, Inc. | 20.11 | 7.9 | 10,393.3 | 18.7 | 147.3 |
| SJT | San Juan Basin Royalty Trust | 2.58 | 12.0 | 120.3 | 7.0 | 83.6 |
| SKIS | Peak Resorts, Inc. | 11.00 | 2.5 | 167.5 | -68.8 | -175.0 |
| SKT | Tanger Factory Outlet Centers, Inc. | 17.32 | 10.2 | 1,620.2 | 22.3 | 227.5 |
| SLP | Simulations Plus, Inc. | 33.56 | 0.9 | 588.3 | 74.6 | 66.7 |
| SMBC | Southern Missouri Bancorp, Inc. | 35.96 | 1.9 | 330.9 | 11.1 | 21.3 |
| SNH | Senior Housing Properties Trust | 9.84 | 8.5 | 2,339.3 | -29.3 | -249.9 |
| SONA | Southern National Bancorp of Virginia, Inc. | 15.49 | 2.8 | 374.4 | 11.7 | 33.2 |
| SONC | Sonic Corp. | 0.00 | 0.0 | 0.0 | ||
| SPG | Simon Property Group, Inc. | 153.84 | 5.3 | 101,969.2 | 21.9 | 117.0 |
| SRCE | 1st Source Corp. | 51.25 | 2.6 | 1,307.3 | 14.5 | 38.1 |
| SSB | South State Corp. | 77.79 | 2.0 | 2,696.0 | 14.7 | 29.2 |
| SSBI | Summit State Bank (California) | 12.50 | 4.8 | 74.1 | 13.2 | 63.2 |
| SSFN | Stewardship Financial Corp. | 15.75 | 0.8 | 137.2 | 19.5 | 14.8 |
| STAG | STAG Industrial, Inc. | 30.92 | 5.8 | 4,233.8 | ||
| STBA | S&T Bancorp, Inc. | 37.73 | 3.6 | 1,299.7 | ||
| STL | Sterling Bancorp (Montebello, New York) | 20.19 | 1.7 | 4,094.4 | 9.9 | 17.2 |
| STZ | Constellation Brands, Inc. | 192.92 | 1.9 | 36,970.3 | 46.8 | 90.4 |
| SXI | Standex International Corp. | 74.69 | 1.3 | 942.3 | 19.8 | 26.7 |
| SYF | Synchrony Financial | 35.68 | 3.0 | 23,056.2 | 6.5 | 19.4 |
| T | AT&T, Inc. | 38.49 | 5.3 | 281,246.4 | 17.2 | 91.0 |
| TAIT | Taitron Components, Inc. | 2.55 | 4.7 | 14.7 | 10.6 | 49.9 |
| TBNK | Territorial Bancorp, Inc. | 28.98 | 4.9 | 280.4 | 12.4 | 60.2 |
| TEO | Telecom Argentina SA | 9.15 | 14.3 | 1,156.1 | 10.8 | 154.5 |
| TESS | TESSCO Technologies, Inc. | 15.75 | 5.1 | 134.2 | 69.7 | 353.8 |
| TK | Teekay Corp. | 5.67 | 1.9 | 571.4 | -3.7 | -7.2 |
| TLYS | Tilly's, Inc. | 10.56 | 9.5 | 313.0 | 13.0 | 122.8 |
| TMK | Torchmark Corp. | 88.10 | 0.8 | 9,685.8 | 13.7 | 10.3 |
| TMP | Tompkins Financial Corp. | 87.09 | 2.9 | 1,304.3 | 16.6 | 48.1 |
| TOWR | Tower International, Inc. | 31.00 | 1.3 | 641.4 | 64.2 | 80.8 |
| TRCB | Two River Bancorp | 21.14 | 1.5 | 184.2 | 16.5 | 25.0 |
| TRGP | Targa Resources Corp. | 41.05 | 11.1 | 9,555.7 | -31.4 | -348.2 |
| TSBK | Timberland Bancorp, Inc. (Washington) | 26.63 | 2.9 | 222.1 | 9.8 | 28.6 |
| TXN | Texas Instruments Incorporated | 120.00 | 3.3 | 112,221.4 | 21.9 | 72.6 |
| UBNK | United Financial Bancorp, Inc. | 14.67 | 3.3 | 749.5 | 21.7 | 70.6 |
| UBSH | 0.00 | 0.0 | 0.0 | |||
| UCFC | United Community Financial Corp. | 11.24 | 2.7 | 540.5 | 14.0 | 37.3 |
| UNB | Union Bankshares, Inc. (Vermont) | 32.65 | 3.8 | 145.9 | 19.5 | 74.0 |
| UNM | Unum Group | 28.60 | 4.7 | 5,966.8 | 11.5 | 54.2 |
| UTL | UNITIL Corp. | 61.10 | 3.0 | 912.0 | 20.8 | 62.7 |
| UVV | Universal Corp. | 54.71 | 5.5 | 1,366.2 | 14.8 | 81.7 |
| VALU | Value Line, Inc. | 23.28 | 3.4 | 224.9 | 19.2 | 65.1 |
| VET | Vermilion Energy, Inc. | 15.43 | 19.4 | 2,394.1 | 8.9 | 172.6 |
| VIVO | Meridian Bioscience, Inc. | 9.93 | 2.5 | 424.1 | 16.4 | 41.3 |
| VNO | Vornado Realty Trust | 64.04 | 8.2 | 12,219.7 | 4.3 | 34.9 |
| VOC | VOC Energy Trust | 5.30 | 17.3 | 90.1 | 7.3 | 126.2 |
| VRTS | Virtus Investment Partners, Inc. | 107.80 | 2.7 | 748.7 | 11.3 | 30.1 |
| VSEC | VSE Corp. | 33.56 | 1.3 | 368.2 | 10.2 | 12.8 |
| VZ | Verizon Communications, Inc. | 60.18 | 4.0 | 248,904.5 | 15.5 | 62.2 |
| WAB | Westinghouse Air Brake Technologies Corp. | 70.00 | 0.9 | 13,418.9 | 38.6 | 33.1 |
| WABC | Westamerica Bancorporation | 65.97 | 3.1 | 1,782.1 | 22.5 | 69.4 |
| WAFD | Washington Federal, Inc. | 36.56 | 2.2 | 2,882.4 | 14.0 | 30.3 |
| WBS | Webster Financial Corp. | 45.04 | 3.2 | 4,192.1 | 10.8 | 34.7 |
| WCFB | WCF Bancorp, Inc. | 8.38 | 0.6 | 21.5 | -275.7 | -164.5 |
| WDR | Waddell & Reed Financial, Inc. | 16.14 | 6.2 | 1,179.4 | 7.9 | 48.7 |
| WETF | WisdomTree Investments, Inc. | 5.27 | 4.5 | 823.6 | 268.9 | 1,213.0 |
| WIT | Wipro Ltd. | 3.94 | 0.4 | 23,557.5 | 16.8 | 6.0 |
| WMK | Weis Markets, Inc. | 37.26 | 3.3 | 996.0 | 16.1 | 53.9 |
| WRK | WestRock Co. | 38.44 | 4.7 | 9,892.2 | 11.8 | 55.9 |
| WSBF | Waterstone Financial, Inc. | 18.56 | 5.3 | 503.8 | 14.9 | 78.5 |
| WSFS | WSFS Financial Corp. | 43.62 | 1.3 | 2,287.7 | ||
| WSM | Williams-Sonoma, Inc. | 68.25 | 2.7 | 5,325.0 | 15.4 | 42.2 |
| WSR | Whitestone REIT | 14.08 | 9.4 | 566.5 | 30.9 | 292.1 |
| WST | West Pharmaceutical Services, Inc. | 142.49 | 0.4 | 10,508.5 | 45.8 | 19.6 |
| WTBA | West Bancorporation, Inc. | 23.51 | 4.4 | 385.1 | 13.6 | 59.4 |
| WTFC | Wintrust Financial Corp. | 66.62 | 1.8 | 3,794.3 | 11.0 | 19.8 |
| WWW | Wolverine World Wide, Inc. | 29.33 | 1.3 | 2,503.0 | 15.5 | 20.1 |
| WYNN | Wynn Resorts Ltd. | 123.00 | 2.8 | 13,236.8 | 15.9 | 45.3 |
| XLNX | Xilinx, Inc. | 94.75 | 1.9 | 23,826.5 | 25.2 | 48.6 |
| ZION | Zions Bancorporation NA | 48.80 | 5.3 | 8,314.2 | 10.8 | 57.6 |
| Ticker | Name | Price | Dividend Yield | Market Cap ($M) | P/E Ratio | Payout Ratio |
Keep reading this article to learn more about using the February dividend stocks list to improve your investing outcomes.
How To Use The February Dividend Stocks List to Find Investment Ideas
Having a spreadsheet database with the names, tickers, and financial characteristics of every stock that pays dividends in the month of February can be extremely powerful.
This document becomes even more useful when combined with a rudimentary knowledge of Microsoft Excel.
With that in mind, this tutorial will demonstrate how you can use the February dividend stocks list to apply quantitative financial screens to this database of dividend stocks.
The first screen that we will implement is for stocks that pay dividends in February with price-to-earnings ratios below 15 and returns on equity above 20%.
Screen 1: Price-to-Earnings Ratios Below 15 and Dividend Yields Above 4%
Step 1: Download your list of stocks that pay dividends in February by clicking here. Apply Excel’s filter function to every column in the spreadsheet.
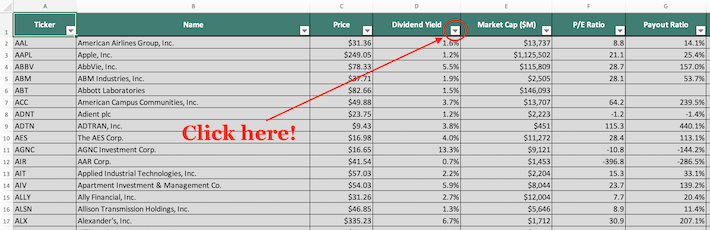
Step 2: Click on the filter icon at the top of the price-to-earnings ratio column, as shown below.
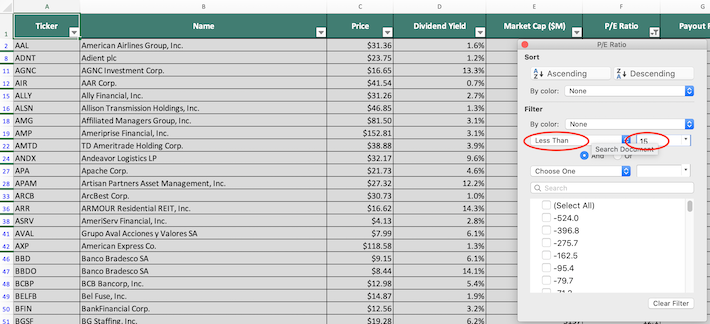
Step 3: Change the filter setting to “Less Than” and input 15 into the field beside it. This will filter for stocks that pay dividends in February that trade with price-to-earnings ratios below 15.
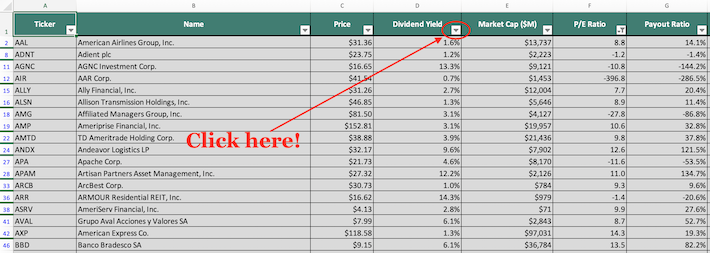
Step 4: Close out of the filter window (by clicking the exit button, not by clicking the “Clear Filter” button in the bottom right corner). Next, click the filter icon at the top of the dividend yield column, as shown below.
Step 5: Change the filter setting to “Greater Than” and input 0.04 into the field beside it. Since dividend yield is measured in percentage points, this is equivalent to filtering for stocks that pay dividends in February with dividend yields above 4%.
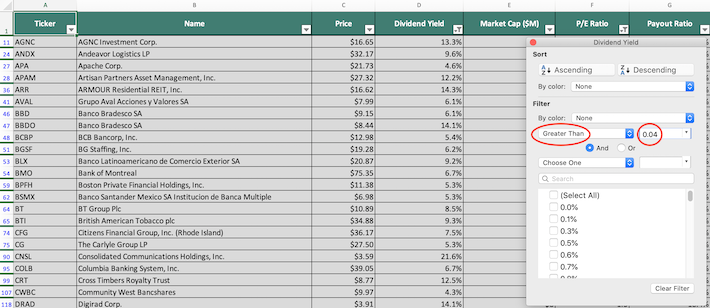
The remaining securities in this spreadsheet are stocks that pay dividends in February with price-to-earnings ratios below 15 and dividend yields above 4%
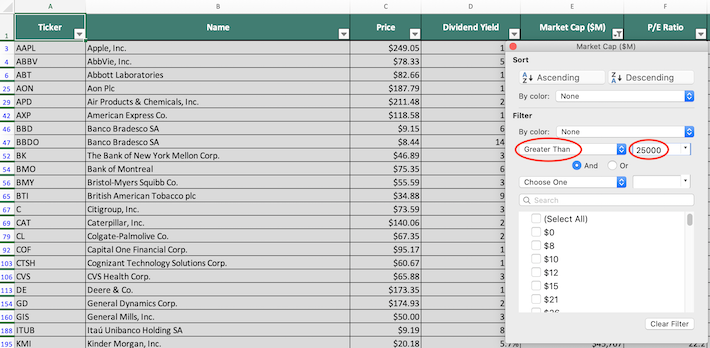
The next screen that we’ll demonstrate is for stocks that pay dividends in February with market capitalizations above $25 billion and 3-year betas below 1.
Screen 2: Market Capitalizations Above $25 Billion and 3-Year Betas Below 1
Step 1: Download your list of stocks that pay dividends in February by clicking here. Apply Excel’s filter function to every column in the spreadsheet.
Step 2: Click the filter icon at the top of the market capitalization column, as shown below.
Step 3: Change the filter setting to “Greater Than” and input 25000 into the field beside it. Since market capitalization is measured in millions of dollars in this database, this is equivalent to filtering for stocks with market capitalizations above $25 billion.
Step 4: Close out of the filter window (by clicking the exit button, not by clicking the “Clear Filter” button in the bottom right corner). Next, click on the filter icon at the top of the beta column, as shown below.
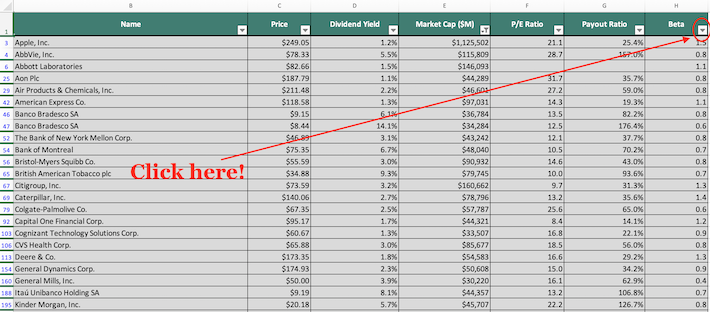
Step 5: Change the filter setting to “Less Than” and input 1 into the field beside it. This will filter for stocks that pay dividends in February with 3-year betas below 1.

The remaining stocks in this spreadsheet are stocks that pay dividends in February that have market capitalizations above $25 billion and 3-year betas below 1.
You now have a solid, fundamental understanding of how to use the February dividend stocks list to find investment ideas.
To conclude this article, we’ll recommend several alternative places to find high-quality dividend growth investment opportunities.
Final Thoughts: Other Useful Investing Databases
Having an Excel document that contains the name, tickers, and financial information for all stocks that pay dividends in February is quite useful – but it becomes far more useful when combined with other databases for the non-February months of the calendar year.
Fortunately, Sure Dividend also maintains similar databases for the other 11 months of the year. You can access these databases below:
- The Complete List of Stocks That Pay Dividends in January
- The Complete List of Stocks That Pay Dividends in March
- The Complete List of Stocks That Pay Dividends in April
- The Complete List of Stocks That Pay Dividends in May
- The Complete List of Stocks That Pay Dividends in June
- The Complete List of Stocks That Pay Dividends in July
- The Complete List of Stocks That Pay Dividends in August
- The Complete List of Stocks That Pay Dividends in September
- The Complete List of Stocks That Pay Dividends in October
- The Complete List of Stocks That Pay Dividends in November
- The Complete List of Stocks That Pay Dividends in December
Having an investment portfolio that generates a roughly equal amount of dividend income each month is very important for retirees.
It is also important to be diversified by sector. With this in mind, Sure Dividend maintains (and updates monthly) a free database for all 10 sectors of the stock market. You can access these databases below:
- The Complete List of Dividend-Paying Utility Stocks
- The Complete List of Dividend-Paying Consumer Staples Stocks
- The Complete List of Dividend-Paying Consumer Cyclical Stocks
- The Complete List of Dividend-Paying Telecommunications Stocks
- The Complete List of Dividend-Paying Technology Stocks
- The Complete List of Dividend-Paying Healthcare Stocks
- The Complete List of Dividend-Paying Energy Stocks
- The Complete List of Dividend-Paying Industrial Stocks
- The Complete List of Dividend-Paying Materials Stocks
- The Complete List of Dividend-Paying Financial Stocks
You may also be looking to invest in dividend growth stocks with high probabilities of continuing to raise their dividends each year into the future.
The following Sure Dividend databases contain the most reliable dividend growers in our investment universe:
- The Dividend Aristocrats: S&P 500 stocks with 25+ years of consecutive dividend increases.
- The Dividend Achievers: dividend stocks with 10+ years of consecutive dividend increases.
- The Dividend Kings: considered to be the ultimate dividend growth stocks, the Dividend Kings list is comprised of stocks with 50+ years of consecutive dividend increases
If you’re looking for stocks with unique dividend characteristics, consider the following Sure Dividend databases:
- The Complete List of Monthly Dividend Stocks
- The Complete List of High Dividend Stocks With 5%+ Yields
- The Blue Chip Stocks List: this database contains stocks with 3%+ dividend yields and 100+ year operating histories
A last (and very comprehensive) method for finding investment opportunities is by looking inside of the major domestic stock market indices. With this in mind, the following databases are useful for the investor who is willing to roll up their sleeves and perform some serious due diligence: