


Spreadsheet data updated daily
In the accumulation stage, investors do not need to generate meaningful income from their investment portfolios. They are instead focused on generating the maximum return possible for a given level of risk.
Retired investors face entirely different challenges. They need to generate consistent dividend income that varies little on a month-to-month basis. This means retirees are required to dilligently structure their portfolio so that they receive the same amount of dividends each month.
With this in mind, we have constructed a list of stocks that pay dividends in March, which you can download below:
The list of stocks that pay dividends in March available for download at the link above contains the following metrics for each stock in the database:
- Name
- Ticker
- Stock price
- Dividend yield
- Market capitalization
- P/E Ratio
- Payout Ratio
- Beta
Additionally, you can find and sort March paying dividend stocks using the table below.
| AAT | American Assets Trust, Inc. | 47.02 | 2.4 | 2,808.1 | 60.5 | 144.1 |
| ABC | AmerisourceBergen Corp. | 87.39 | 1.8 | 18,205.6 | 19.4 | 35.5 |
| ABEV | Ambev SA | 4.37 | 1.9 | 68,754.5 | 23.3 | 43.5 |
| ABR | Arbor Realty Trust, Inc. | 13.54 | 9.3 | 1,277.4 | 9.4 | 87.9 |
| ABX | Barrick Gold Corporation | 0.00 | 0.0 | 0.0 | ||
| ACET | 0.00 | 0.0 | 0.0 | |||
| ACNB | ACNB Corp. | 34.65 | 3.5 | 245.1 | 10.3 | 36.0 |
| ADI | Analog Devices, Inc. | 108.83 | 1.9 | 40,202.5 | 26.6 | 51.3 |
| ADM | Archer-Daniels-Midland Co. | 41.30 | 3.4 | 23,003.0 | 17.6 | 59.2 |
| ADS | Alliance Data Systems Corp. | 106.79 | 2.9 | 5,456.8 | 12.4 | 36.0 |
| AE | Adams Resources & Energy, Inc. | 30.79 | 3.0 | 130.4 | 41.9 | 125.2 |
| AEE | Ameren Corp. | 75.84 | 3.2 | 18,641.7 | 23.4 | 73.8 |
| AEM | Agnico Eagle Mines Ltd. | 58.44 | 3.1 | 13,986.4 | -53.9 | -169.3 |
| AEP | American Electric Power Co., Inc. | 93.37 | 3.6 | 46,120.3 | 21.6 | 78.3 |
| AFL | Aflac, Inc. | 53.51 | 2.5 | 39,336.8 | 13.1 | 32.9 |
| AGCO | AGCO Corp. | 77.00 | 1.0 | 5,870.5 | 15.8 | 16.0 |
| AGM | Federal Agricultural Mortgage Corp. | 85.33 | 3.1 | 913.1 | 9.5 | 29.7 |
| AGN | Allergan Plc | 174.22 | 2.1 | 57,161.1 | -6.8 | -14.4 |
| AGNC | AGNC Investment Corp. | 16.65 | 13.3 | 9,121.2 | -10.8 | -144.2 |
| AGO | Assured Guaranty Ltd. | 46.72 | 1.5 | 4,611.7 | 11.0 | 16.5 |
| AHC | A.H. Belo Corp. | 3.70 | 10.8 | 79.5 | 6.2 | 66.6 |
| AHL | Aspen Insurance Holdings Limited | 0.00 | 0.0 | 0.0 | ||
| AIG | American International Group, Inc. | 52.55 | 2.4 | 45,713.7 | -525.5 | -1,280.0 |
| AIZ | Assurant, Inc. | 125.31 | 1.9 | 7,660.3 | 21.3 | 40.7 |
| AJG | Arthur J. Gallagher & Co. | 89.70 | 2.4 | 16,690.5 | 24.1 | 57.3 |
| AJX | Great Ajax Corp. | 15.56 | 8.5 | 305.8 | 8.9 | 75.9 |
| ALE | ALLETE, Inc. | 85.43 | 3.4 | 4,413.0 | 22.4 | 76.3 |
| ALGT | Allegiant Travel Co. | 171.38 | 2.0 | 2,784.2 | 13.1 | 26.8 |
| ALK | Alaska Air Group, Inc. | 70.08 | 2.0 | 8,639.3 | 14.1 | 27.7 |
| ALLE | Allegion Plc | 115.32 | 0.9 | 10,715.2 | 23.9 | 21.1 |
| ALOT | AstroNova, Inc. | 15.86 | 1.8 | 111.8 | 17.3 | 30.6 |
| ALV | Autoliv, Inc. | 79.68 | 3.8 | 7,107.8 | 32.3 | 123.0 |
| AMAT | Applied Materials, Inc. | 56.95 | 1.8 | 52,607.8 | 18.8 | 33.9 |
| AMC | AMC Entertainment Holdings, Inc. | 9.91 | 10.1 | 1,029.2 | 181.8 | 1,834.9 |
| AME | AMETEK, Inc. | 90.40 | 0.6 | 20,642.5 | 25.1 | 15.6 |
| AMGN | Amgen, Inc. | 205.01 | 3.5 | 122,944.7 | 16.1 | 56.0 |
| AMNB | American National Bankshares, Inc. (Virginia) | 36.48 | 2.8 | 405.5 | 18.9 | 52.8 |
| AMSF | AMERISAFE, Inc. | 62.91 | 7.1 | 1,214.1 | 15.9 | 113.3 |
| ANAT | American National Insurance Co. | 119.60 | 2.7 | 3,215.7 | 7.8 | 21.3 |
| ANF | Abercrombie & Fitch Co. | 17.34 | 4.6 | 1,090.0 | 16.4 | 75.5 |
| ANTM | Anthem, Inc. | 267.67 | 1.5 | 67,871.5 | 16.0 | 23.6 |
| APC | Anadarko Petroleum Corp. | 72.77 | 1.2 | 36,563.5 | -60.9 | -75.3 |
| APLE | Apple Hospitality REIT, Inc. | 16.38 | 7.9 | 3,667.0 | 18.9 | 149.9 |
| ARCC | Ares Capital Corp. | 18.47 | 9.0 | 7,881.5 | 10.1 | 91.7 |
| ARII | American Railcar Industries, Inc. | 0.00 | 0.0 | 0.0 | ||
| ARMK | Aramark | 44.26 | 1.0 | 10,928.2 | 20.3 | 20.2 |
| AROW | Arrow Financial Corp. | 34.78 | 3.0 | 520.6 | 14.2 | 42.5 |
| ARR | ARMOUR Residential REIT, Inc. | 16.62 | 14.3 | 978.8 | -1.4 | -20.6 |
| ASB | Associated Banc-Corp | 20.47 | 3.3 | 3,260.7 | 10.2 | 33.8 |
| ASH | Ashland Global Holdings, Inc. | 77.44 | 1.4 | 4,700.8 | 46.3 | 62.6 |
| ASTE | Astec Industries, Inc. | 31.77 | 2.7 | 747.7 | -303.1 | -804.0 |
| ATO | Atmos Energy Corp. | 110.94 | 1.9 | 13,113.2 | 26.2 | 49.6 |
| ATRI | Atrion Corp. | 830.70 | 0.7 | 1,540.9 | 42.7 | 28.8 |
| AVA | Avista Corp. | 47.65 | 3.2 | 3,150.2 | 15.9 | 51.2 |
| AVAL | Grupo Aval Acciones y Valores SA | 7.99 | 6.1 | 2,842.9 | 8.7 | 52.7 |
| AVGO | Broadcom, Inc. | 291.55 | 3.6 | 115,649.4 | -72.7 | -264.3 |
| AVT | Avnet, Inc. | 39.86 | 2.0 | 4,024.3 | 31.9 | 64.9 |
| AVX | AVX Corp. | 15.64 | 5.9 | 2,644.6 | 11.4 | 67.0 |
| AVY | Avery Dennison Corp. | 127.49 | 2.2 | 10,733.8 | ||
| AWK | American Water Works Co., Inc. | 119.56 | 1.6 | 21,598.9 | 37.2 | 59.4 |
| AWR | American States Water Co. | 93.10 | 1.2 | 3,429.1 | 45.0 | 54.7 |
| AYR | Aircastle Ltd. | 26.71 | 4.5 | 2,001.9 | 9.9 | 44.3 |
| AZN | AstraZeneca Plc | 47.28 | 2.9 | 125,285.5 | 54.9 | 161.0 |
| B | Barnes Group, Inc. | 56.35 | 1.4 | 2,884.3 | 18.5 | 26.0 |
| BA | The Boeing Co. | 340.88 | 2.9 | 191,844.2 | 51.3 | 149.4 |
| BAC | Bank of America Corp. | 31.84 | 2.5 | 289,083.6 | 11.6 | 29.6 |
| BAM | Brookfield Asset Management, Inc. | 54.74 | 2.7 | 55,271.8 | 18.0 | 48.3 |
| BANX | StoneCastle Financial Corp. | 22.05 | 6.7 | 148.1 | 15.2 | 102.3 |
| BBD | Banco Bradesco SA | 9.15 | 6.1 | 36,784.4 | 13.5 | 82.2 |
| BBDO | Banco Bradesco SA | 8.44 | 14.1 | 34,284.0 | 12.5 | 176.4 |
| BBL | BHP Group Plc | 43.28 | 10.9 | 45,704.3 | 12.7 | 137.9 |
| BBSI | Barrett Business Services, Inc. | 87.96 | 1.2 | 657.1 | 13.7 | 16.3 |
| BBT | BB&T Corp. | 54.00 | 3.9 | 41,380.4 | 13.4 | 52.6 |
| BC | Brunswick Corp. | 60.07 | 1.8 | 5,149.5 | -44.6 | -80.1 |
| BCO | The Brink's Co. | 88.86 | 0.8 | 4,445.2 | 66.7 | 56.3 |
| BDL | Flanigan's Enterprises, Inc. | 22.87 | 1.2 | 42.5 | 12.7 | 15.5 |
| BDX | Becton, Dickinson & Co. | 246.08 | 1.3 | 66,430.3 | 84.6 | 105.8 |
| BG | Bunge Ltd. | 55.53 | 4.5 | 7,860.7 | 14.7 | 66.2 |
| BGCP | BGC Partners, Inc. | 5.36 | 13.8 | 1,866.3 | 33.1 | 456.8 |
| BGFV | Big 5 Sporting Goods Corp. | 2.60 | 7.7 | 56.4 | -191.2 | -1,470.6 |
| BHB | Bar Harbor Bankshares | 25.13 | 4.2 | 390.7 | 15.0 | 63.2 |
| BHBK | 0.00 | 0.0 | 0.0 | |||
| BHLB | Berkshire Hills Bancorp, Inc. | 30.83 | 3.0 | 1,569.4 | 17.5 | 51.6 |
| BHP | BHP Group Ltd. | 49.89 | 9.4 | 73,455.6 | 14.6 | 137.9 |
| BKH | Black Hills Corp. | 77.31 | 2.6 | 4,720.8 | 20.4 | 53.2 |
| BLK | BlackRock, Inc. | 466.56 | 2.8 | 72,397.5 | 17.8 | 49.8 |
| BLKB | Blackbaud, Inc. | 86.38 | 0.6 | 4,247.6 | 206.2 | 114.6 |
| BLL | Ball Corp. | 71.34 | 0.9 | 23,685.1 | 45.7 | 41.7 |
| BLMN | Bloomin' Brands, Inc. | 19.75 | 2.0 | 1,703.6 | 16.6 | 33.0 |
| BMI | Badger Meter, Inc. | 57.69 | 1.1 | 1,679.6 | 36.3 | 39.0 |
| BMS | Bemis Co., Inc. | 57.25 | 1.7 | 5,221.2 | 22.8 | 37.9 |
| BMTC | Bryn Mawr Bank Corp. | 37.76 | 3.4 | 759.9 | 12.7 | 42.7 |
| BOH | Bank of Hawaii Corp. | 86.33 | 6.0 | 3,507.2 | 15.9 | 96.0 |
| BOTJ | Bank of the James Financial Group, Inc. | 14.57 | 2.0 | 64.6 | 11.5 | 23.3 |
| BP | BP Plc | 39.24 | 6.3 | 132,021.5 | 14.8 | 92.8 |
| BRKL | Brookline Bancorp, Inc. | 15.74 | 3.4 | 1,260.4 | 14.5 | 50.0 |
| BRKR | Bruker Corp. | 43.86 | 0.4 | 6,850.2 | 36.4 | 13.1 |
| BRKS | Brooks Automation, Inc. | 44.00 | 0.9 | 3,177.9 | 88.7 | 80.6 |
| BRSS | Global Brass & Copper Holdings, Inc. | 43.99 | 0.6 | 965.7 | 16.0 | 9.8 |
| BSBR | Banco Santander (Brasil) SA | 12.28 | 4.3 | 46,115.4 | 25.4 | 110.0 |
| BTU | Peabody Energy Corp. | 14.93 | 18.5 | 1,661.7 | 3.5 | 64.3 |
| BWA | BorgWarner, Inc. | 40.41 | 1.7 | 8,345.3 | 10.9 | 18.4 |
| BWFG | Bankwell Financial Group, Inc. | 27.93 | 1.8 | 219.0 | 11.7 | 21.3 |
| BWXT | BWX Technologies, Inc. | 57.54 | 1.2 | 5,490.4 | 26.9 | 31.2 |
| CA | CA, Inc. | 0.00 | 0.0 | 0.0 | ||
| CABO | Cable One, Inc. | 1,313.75 | 0.6 | 7,496.3 | 48.0 | 30.1 |
| CAE | CAE, Inc. | 25.39 | 1.6 | 6,767.3 | 27.8 | 44.8 |
| CAG | Conagra Brands, Inc. | 27.30 | 3.1 | 13,285.7 | 19.1 | 59.5 |
| CAKE | Cheesecake Factory, Inc. | 42.87 | 3.2 | 1,876.3 | 17.8 | 57.3 |
| CASS | Cass Information Systems, Inc. | 54.07 | 2.4 | 783.4 | 25.1 | 60.9 |
| CATO | The Cato Corp. | 17.33 | 7.6 | 429.2 | 12.6 | 96.1 |
| CATY | Cathay General Bancorp | 36.31 | 3.4 | 2,894.2 | 10.5 | 36.0 |
| CBFV | CB Financial Services, Inc. | 26.49 | 3.6 | 143.9 | 13.5 | 48.5 |
| CBOE | Cboe Global Markets, Inc. | 113.22 | 1.1 | 12,644.6 | 31.2 | 35.5 |
| CBSH | Commerce Bancshares, Inc. (Missouri) | 64.58 | 1.6 | 6,933.6 | 17.2 | 27.1 |
| CBT | Cabot Corp. | 45.60 | 3.0 | 2,638.9 | 12.6 | 37.4 |
| CC | The Chemours Co. | 16.99 | 5.9 | 2,777.6 | 4.8 | 28.3 |
| CCBG | Capital City Bank Group, Inc. | 26.34 | 1.5 | 478.4 | 15.8 | 24.3 |
| CCE | Coca-Cola European Partners plc | 0.00 | 0.0 | 0.0 | ||
| CCI | Crown Castle International Corp. | 139.40 | 4.1 | 57,990.4 | 69.9 | 285.7 |
| CCL | Carnival Corp. | 44.18 | 5.7 | 23,276.3 | 10.0 | 56.4 |
| CCNE | CNB Financial Corp. (Pennsylvania) | 31.86 | 2.1 | 484.2 | ||
| CCOI | Cogent Communications Holdings, Inc. | 58.31 | 4.0 | 2,729.8 | 83.3 | 337.0 |
| CDK | CDK Global, Inc. | 50.18 | 1.2 | 6,092.2 | 54.0 | 64.6 |
| CDW | CDW Corp. | 125.14 | 0.9 | 18,232.6 | 26.8 | 25.1 |
| CE | Celanese Corp. | 121.56 | 2.0 | 14,693.4 | 16.9 | 33.3 |
| CFR | Cullen/Frost Bankers, Inc. | 93.74 | 2.9 | 5,873.4 | 13.1 | 38.5 |
| CGNX | Cognex Corp. | 50.81 | 0.4 | 9,212.3 | 51.5 | 19.1 |
| CHCT | Community Healthcare Trust, Inc. | 46.69 | 3.5 | 906.1 | 354.8 | 1,242.4 |
| CHD | Church & Dwight Co., Inc. | 74.60 | 1.2 | 18,433.4 | 30.4 | 36.7 |
| CHE | Chemed Corp. | 408.75 | 0.3 | 6,508.1 | 32.5 | 9.7 |
| CHFC | Chemical Financial Corp. | 42.04 | 3.2 | 3,008.3 | 10.9 | 35.2 |
| CHKR | Chesapeake Granite Wash Trust | 0.51 | 35.4 | 23.7 | 2.4 | 85.5 |
| CHRW | C.H. Robinson Worldwide, Inc. | 90.33 | 2.2 | 12,228.7 | 18.0 | 39.7 |
| CIX | CompX International, Inc. | 14.67 | 1.8 | 182.5 | 11.8 | 20.8 |
| CLDT | Chatham Lodging Trust | 17.87 | 8.0 | 838.5 | 33.3 | 266.3 |
| CLRO | ClearOne, Inc. | 1.54 | 0.0 | 25.6 | -0.9 | 0.0 |
| CMCT | CIM Commercial Trust Corp. | 14.71 | 98.2 | 214.8 | 0.7 | 64.6 |
| CME | CME Group, Inc. | 200.66 | 2.3 | 71,855.3 | 39.0 | 91.4 |
| CMI | Cummins, Inc. | 180.03 | 3.4 | 28,406.2 | 10.9 | 36.7 |
| CMP | Compass Minerals International, Inc. | 58.15 | 5.0 | 1,970.4 | 33.5 | 165.8 |
| CNA | CNA Financial Corp. | 44.25 | 10.9 | 11,981.6 | 18.7 | 203.3 |
| CNI | Canadian National Railway Co. | 89.74 | 6.4 | 64,305.5 | 19.2 | 123.3 |
| CNK | Cinemark Holdings, Inc. | 37.01 | 3.6 | 4,335.8 | 21.3 | 77.1 |
| CNO | CNO Financial Group, Inc. | 15.94 | 2.6 | 2,491.2 | -6.4 | -16.8 |
| CNP | CenterPoint Energy, Inc. | 29.14 | 4.9 | 14,634.7 | 25.5 | 125.0 |
| CNS | Cohen & Steers, Inc. (New York) | 63.05 | 6.2 | 2,978.5 | 24.1 | 149.4 |
| COL | Rockwell Collins, Inc. | 0.00 | 0.0 | 0.0 | ||
| COLM | Columbia Sportswear Co. | 95.14 | 1.0 | 6,427.4 | 21.1 | 21.3 |
| COP | ConocoPhillips | 55.68 | 2.4 | 61,812.6 | 8.9 | 21.4 |
| CORE | Core-Mark Holding Co., Inc. | 29.34 | 1.5 | 1,346.1 | 24.6 | 36.8 |
| COST | Costco Wholesale Corp. | 298.94 | 1.0 | 131,431.1 | 35.9 | 37.1 |
| COT | Cott Corp. (Canada) | 12.87 | 4.4 | 1,735.8 | -307.8 | -1,339.0 |
| COTY | Coty, Inc. | 11.79 | 2.7 | 8,892.7 | -2.3 | -6.2 |
| CPA | Copa Holdings SA | 104.87 | 2.7 | 4,426.6 | 106.1 | 285.6 |
| CPF | Central Pacific Financial Corp. | 29.18 | 3.8 | 825.9 | 14.0 | 53.5 |
| CPG | Crescent Point Energy Corp. | 3.94 | 3.0 | 2,166.9 | -1.3 | -4.0 |
| CPSI | Computer Programs & Systems, Inc. | 23.21 | 1.7 | 333.2 | 17.8 | 30.6 |
| CQH | Cheniere Energy Partners LP Holdings, LLC | 0.00 | 0.0 | 0.0 | ||
| CR | Crane Co. | 75.52 | 1.8 | 5,051.8 | 12.5 | 22.6 |
| CRI | Carter's, Inc. | 99.57 | 2.0 | 4,413.0 | 16.8 | 32.7 |
| CRS | Carpenter Technology Corp. | 50.97 | 1.6 | 2,432.3 | 13.9 | 21.9 |
| CRT | Cross Timbers Royalty Trust | 8.77 | 12.5 | 52.6 | 7.3 | 92.1 |
| CSB | VictoryShares US Small Cap High Div Volatility Wtd ETF | 45.92 | 0.0 | 0.0 | ||
| CSFL | CenterState Bank Corp. | 25.12 | 2.1 | 3,259.2 | 13.6 | 29.0 |
| CSGS | CSG Systems International, Inc. | 51.36 | 1.7 | 1,682.1 | 21.9 | 37.7 |
| CSL | Carlisle Cos., Inc. | 155.70 | 1.1 | 8,824.0 | 19.6 | 21.3 |
| CSPI | CSP, Inc. | 13.12 | 4.6 | 54.5 | -39.9 | -182.6 |
| CSS | CSS Industries, Inc. | 4.45 | 9.0 | 39.4 | -0.8 | -7.2 |
| CSV | Carriage Services, Inc. | 22.99 | 1.6 | 405.8 | 44.1 | 72.6 |
| CSX | CSX Corp. | 71.52 | 1.6 | 55,616.6 | 17.0 | 28.0 |
| CTB | Cooper Tire & Rubber Co. | 30.36 | 1.7 | 1,522.8 | 34.1 | 58.9 |
| CTL | CenturyLink, Inc. | 12.93 | 10.0 | 14,103.7 | -1.7 | -17.4 |
| CTRN | Citi Trends, Inc. | 18.14 | 1.8 | 216.1 | 14.7 | 26.0 |
| CTT | CatchMark Timber Trust, Inc. | 11.60 | 4.7 | 568.5 | -3.2 | -14.9 |
| CTWS | Connecticut Water Service, Inc. | 69.98 | 1.8 | 844.6 | 39.4 | 72.1 |
| CUB | Cubic Corp. | 72.07 | 0.4 | 2,247.0 | 76.7 | 28.7 |
| CUK | Carnival Plc | 41.71 | 6.0 | 7,667.5 | 9.4 | 56.4 |
| CVE | Cenovus Energy, Inc. | 8.68 | 3.0 | 10,690.6 | 51.5 | 155.2 |
| CVI | CVR Energy, Inc. | 47.11 | 8.1 | 4,736.0 | 11.3 | 91.4 |
| CVR | Chicago Rivet & Machine Co. | 26.00 | 4.5 | 25.1 | 22.7 | 102.1 |
| CVX | Chevron Corp. | 118.48 | 4.0 | 224,924.8 | 15.2 | 60.3 |
| CWH | Camping World Holdings, Inc. | 9.83 | 6.2 | 865.8 | -20.7 | -128.8 |
| CXP | Columbia Property Trust, Inc. | 20.16 | 4.0 | 2,356.7 | -368.6 | -1,462.5 |
| CZWI | Citizens Community Bancorp, Inc. (Wisconsin) | 11.18 | 1.8 | 126.0 | 16.3 | 29.2 |
| D | Dominion Energy, Inc. | 81.33 | 4.4 | 66,846.3 | 54.6 | 240.8 |
| DAKT | Daktronics, Inc. | 7.15 | 3.4 | 321.4 | 206.1 | 691.6 |
| DAL | Delta Air Lines, Inc. | 55.17 | 3.4 | 35,680.8 | 7.7 | 26.0 |
| DAN | Dana, Inc. | 16.67 | 3.0 | 2,404.9 | 10.7 | 32.0 |
| DBD | Diebold Nixdorf, Inc. | 7.74 | 0.0 | 758.3 | -1.1 | 0.0 |
| DCI | Donaldson Co., Inc. | 53.60 | 1.5 | 6,764.1 | 25.8 | 38.4 |
| DEA | Easterly Government Properties, Inc. | 22.03 | 4.7 | 1,762.6 | 198.3 | 936.1 |
| DF | Dean Foods Co. | 1.11 | 2.7 | 102.0 | -0.2 | -0.7 |
| DFS | Discover Financial Services | 81.43 | 2.6 | 25,650.5 | 9.2 | 23.5 |
| DHI | D.R. Horton, Inc. | 51.82 | 1.2 | 19,164.1 | 12.3 | 14.2 |
| DHXM | DHX Media Ltd. | 1.44 | 0.0 | 246.1 | -2.7 | 0.0 |
| DIT | AMCON Distributing Co. | 74.10 | 1.6 | 43.9 | 10.2 | 16.2 |
| DK | Delek US Holdings, Inc. | 40.05 | 2.8 | 2,990.8 | 6.2 | 17.1 |
| DKS | Dick's Sporting Goods, Inc. | 38.99 | 2.7 | 3,542.8 | 11.5 | 30.9 |
| DLR | Digital Realty Trust, Inc. | 132.28 | 3.2 | 27,559.6 | 121.2 | 389.4 |
| DLX | Deluxe Corp. | 53.75 | 2.8 | 2,263.0 | -12.3 | -34.2 |
| DNB | The Dun & Bradstreet Corporation | 0.00 | 0.0 | 0.0 | ||
| DNBF | DNB Financial Corp. (Pennsylvania) | 45.67 | 0.8 | 198.0 | 17.9 | 13.7 |
| DNKN | Dunkin' Brands Group, Inc. | 73.69 | 2.0 | 6,096.2 | 26.4 | 52.7 |
| DOV | Dover Corp. | 104.21 | 1.9 | 15,138.2 | 23.3 | 43.1 |
| DPZ | Domino's Pizza, Inc. | 266.84 | 1.2 | 11,021.8 | 28.6 | 33.4 |
| DRD | DRDGOLD Ltd. | 4.75 | 2.8 | 318.8 | 59.8 | 169.6 |
| DRYS | DryShips, Inc. | 5.24 | 0.0 | 455.3 | 99.1 | 0.0 |
| DUK | Duke Energy Corp. | 94.10 | 8.0 | 68,561.4 | 20.8 | 165.7 |
| DVN | Devon Energy Corp. | 21.05 | 2.0 | 8,508.4 | 2.6 | 5.3 |
| DWDP | DowDuPont, Inc. | 30.52 | 5.0 | 68,559.8 | 21.5 | 107.0 |
| EAT | Brinker International, Inc. | 44.20 | 3.5 | 1,632.1 | 10.9 | 37.8 |
| EBIX | Ebix, Inc. | 43.82 | 0.7 | 1,341.2 | 14.7 | 10.0 |
| EBMT | Eagle Bancorp Montana, Inc. | 18.89 | 2.5 | 121.0 | 11.8 | 29.3 |
| EBTC | Enterprise Bancorp, Inc. | 30.34 | 2.6 | 358.5 | 11.2 | 28.9 |
| ECA | Encana Corp. | 4.16 | 1.7 | 5,614.7 | 3.6 | 6.1 |
| ECC | Eagle Point Credit Co., Inc. | 15.53 | 18.0 | 377.6 | -14.1 | -254.3 |
| ED | Consolidated Edison, Inc. | 91.09 | 4.0 | 30,255.0 | 21.5 | 86.8 |
| EE | El Paso Electric Co. | 67.01 | 2.8 | 2,733.4 | 30.2 | 84.6 |
| EFSC | Enterprise Financial Services Corp. | 44.34 | 1.7 | 1,180.0 | 12.8 | 21.6 |
| EFX | Equifax, Inc. | 136.69 | 1.1 | 16,550.8 | -43.1 | -49.2 |
| EGOV | NIC, Inc. | 20.36 | 1.6 | 1,363.3 | 26.5 | 41.7 |
| EGP | EastGroup Properties, Inc. | 133.15 | 2.2 | 5,001.0 | 54.2 | 118.4 |
| EIG | Employers Holdings, Inc. | 41.93 | 2.6 | 1,334.0 | 9.0 | 23.1 |
| EL | The Estée Lauder Companies, Inc. | 185.71 | 0.9 | 67,064.3 | 37.8 | 35.0 |
| ELY | Callaway Golf Co. | 20.95 | 0.2 | 1,978.8 | 33.8 | 6.4 |
| EMCI | EMC Insurance Group, Inc. | 36.01 | 2.6 | 780.5 | 24.0 | 61.3 |
| EML | The Eastern Co. | 28.02 | 1.6 | 174.7 | 14.3 | 22.4 |
| EMR | Emerson Electric Co. | 70.99 | 2.8 | 43,666.0 | 20.0 | 55.1 |
| ENB | Enbridge, Inc. | 36.64 | 13.8 | 74,153.1 | 21.4 | 294.3 |
| ENR | Energizer Holdings, Inc. | 42.94 | 2.8 | 2,965.5 | 370.1 | 1,032.0 |
| ENS | EnerSys | 69.24 | 1.0 | 2,941.5 | 18.0 | 18.2 |
| EPM | Evolution Petroleum Corp. | 5.75 | 7.0 | 190.1 | 12.4 | 86.2 |
| EPR | EPR Properties | 78.29 | 6.2 | 6,071.9 | 23.1 | 142.7 |
| EQIX | Equinix, Inc. | 567.13 | 1.7 | 48,103.4 | 93.4 | 159.1 |
| EQT | EQT Corp. | 9.32 | 1.6 | 2,406.8 | -6.6 | -10.5 |
| ERF | Enerplus Corp. | 6.16 | 2.1 | 1,420.7 | 4.4 | 9.4 |
| ES | Eversource Energy | 83.85 | 2.5 | 27,134.0 | 30.9 | 77.8 |
| ESBK | Elmira Savings Bank | 14.23 | 6.5 | 49.6 | 14.3 | 92.3 |
| ESCA | Escalade, Inc. | 11.47 | 4.4 | 165.9 | 17.8 | 77.7 |
| ESP | Espey Manufacturing & Electronics Corp. | 22.09 | 4.5 | 53.0 | 22.5 | 101.6 |
| ESRT | Empire State Realty Trust, Inc. | 14.28 | 2.9 | 2,572.7 | 45.1 | 132.6 |
| ESSA | ESSA Bancorp, Inc. | 16.30 | 2.5 | 186.0 | 13.8 | 34.0 |
| ESV | Ensco Rowan Plc | 8.19 | 2.0 | 1,569.5 | -1.3 | -2.5 |
| ETM | Entercom Communications Corp. | 3.47 | 8.3 | 496.3 | -1.5 | -12.4 |
| ETN | Eaton Corp. Plc | 87.22 | 4.0 | 36,632.4 | 16.9 | 67.7 |
| ETR | Entergy Corp. | 118.12 | 6.2 | 23,485.8 | 22.8 | 142.3 |
| EVC | Entravision Communications Corp. | 2.79 | 7.2 | 237.1 | -39.3 | -281.7 |
| EVR | Evercore, Inc. | 76.12 | 3.6 | 3,035.1 | 8.6 | 31.0 |
| EXC | Exelon Corp. | 45.60 | 3.1 | 44,304.2 | 19.4 | 61.1 |
| EXPE | Expedia Group, Inc. | 138.09 | 0.9 | 20,060.1 | 33.3 | 31.3 |
| EXPO | Exponent, Inc. | 63.83 | 1.2 | 3,314.0 | 42.4 | 51.1 |
| EXR | Extra Space Storage, Inc. | 112.07 | 3.1 | 15,177.9 | 33.0 | 103.7 |
| F | Ford Motor Co. | 8.61 | 7.0 | 34,139.1 | 20.9 | 145.8 |
| FAF | First American Financial Corp. | 61.41 | 2.7 | 6,888.4 | 12.1 | 33.1 |
| FBHS | Fortune Brands Home & Security, Inc. | 60.67 | 1.8 | 8,486.6 | ||
| FBNK | FaceBank Group, Inc. | 10.18 | 0.0 | 254.8 | -5.5 | 0.0 |
| FCAP | First Capital, Inc. | 61.04 | 1.5 | 205.3 | 19.5 | 30.1 |
| FCBC | First Community Bancshares, Inc. (Virginia) | 32.45 | 3.6 | 505.6 | 13.3 | 48.1 |
| FDP | Fresh Del Monte Produce, Inc. | 28.55 | 0.7 | 1,380.6 | 74.5 | 54.8 |
| FDS | FactSet Research Systems, Inc. | 257.89 | 1.1 | 9,865.8 | ||
| FE | FirstEnergy Corp. | 47.27 | 4.0 | 25,525.2 | 22.7 | 90.5 |
| FF | FutureFuel Corp. | 12.63 | 2.3 | 559.5 | 27.0 | 63.3 |
| FFBC | First Financial Bancorp (Ohio) | 23.87 | 4.6 | 2,415.0 | 11.4 | 52.7 |
| FFG | FBL Financial Group, Inc. | 57.46 | 5.9 | 2,833.9 | 13.8 | 81.4 |
| FFIC | Flushing Financial Corp. | 21.80 | 3.8 | 614.5 | 13.1 | 49.7 |
| FFNW | First Financial Northwest, Inc. | 14.11 | 5.0 | 145.3 | 14.3 | 71.1 |
| FGBI | First Guaranty Bancshares, Inc. | 21.55 | 3.0 | 189.8 | 15.4 | 45.6 |
| FIS | Fidelity National Information Services, Inc. | 130.22 | 1.3 | 79,882.7 | 56.0 | 74.0 |
| FIX | Comfort Systems USA, Inc. | 50.95 | 1.0 | 1,862.8 | 17.8 | 17.0 |
| FLIR | FLIR Systems, Inc. | 54.77 | 1.2 | 7,427.1 | 26.8 | 32.8 |
| FLO | Flowers Foods, Inc. | 21.57 | 3.4 | 4,562.4 | 25.4 | 87.2 |
| FMNB | Farmers National Banc Corp. | 14.88 | 2.4 | 411.7 | 11.9 | 28.8 |
| FNB | F.N.B. Corp. (Pennsylvania) | 12.32 | 4.9 | 4,005.8 | 10.4 | 50.8 |
| FNF | Fidelity National Financial, Inc. | 44.98 | 2.7 | 12,324.1 | 16.4 | 44.8 |
| FNHC | FedNat Holding Co. | 14.49 | 2.2 | 191.6 | 98.7 | 218.0 |
| FNV | Franco-Nevada Corp. | 93.61 | 2.4 | 17,618.3 | 116.6 | 283.5 |
| FORR | Forrester Research, Inc. | 34.93 | 0.6 | 648.0 | -71.0 | -40.6 |
| FRME | First Merchants Corp. (Indiana) | 39.63 | 2.4 | 2,193.4 | 12.5 | 30.2 |
| FSFG | First Savings Financial Group, Inc. | 61.87 | 1.0 | 145.4 | 9.9 | 10.1 |
| FSS | Federal Signal Corp. | 34.86 | 0.9 | 2,106.4 | 20.0 | 18.4 |
| FTAI | Fortress Transportation & Infrastructure Investors LLC | 15.98 | 8.3 | 1,355.8 | 69.9 | 577.7 |
| FTV | Fortive Corp. | 68.64 | 0.4 | 23,049.6 | 8.9 | 3.6 |
| FWRD | Forward Air Corp. | 71.08 | 1.3 | 2,002.5 | 22.5 | 28.5 |
| G | Genpact Ltd. | 38.29 | 1.1 | 7,315.2 | 25.3 | 27.3 |
| GARS | Garrison Capital, Inc. | 6.68 | 13.8 | 107.2 | -40.6 | -559.6 |
| GATX | GATX Corp. | 81.29 | 4.5 | 2,902.1 | 14.4 | 65.1 |
| GBL | GAMCO Investors, Inc. | 15.98 | 0.5 | 442.6 | 4.4 | 2.2 |
| GBNK | Guaranty Bancorp | 0.00 | 0.0 | 0.0 | ||
| GCAP | GAIN Capital Holdings, Inc. | 4.28 | 7.0 | 160.2 | -5.0 | -35.2 |
| GCI | Gannett Co., Inc. | 11.21 | 7.1 | 1,285.5 | 92.2 | 657.9 |
| GFF | Griffon Corp. | 21.07 | 1.4 | 986.1 | -119.4 | -164.3 |
| GFI | Gold Fields Ltd. | 5.61 | 0.9 | 4,764.6 | 51.8 | 49.0 |
| GG | 0.00 | 0.0 | 0.0 | |||
| GGB | Gerdau SA | 3.28 | 2.9 | 3,645.8 | 10.9 | 31.6 |
| GHL | Greenhill & Co., Inc. | 15.87 | 1.3 | 323.4 | -60.6 | -76.4 |
| GILD | Gilead Sciences, Inc. | 63.73 | 7.8 | 80,682.2 | 30.2 | 235.9 |
| GLOG | GasLog Ltd. | 14.62 | 6.8 | 1,179.5 | -78.8 | -539.2 |
| GLPI | Gaming & Leisure Properties, Inc. | 39.43 | 6.9 | 8,465.0 | 25.1 | 173.4 |
| GLW | Corning, Inc. | 30.61 | 3.2 | 23,902.3 | 17.2 | 55.0 |
| GM | General Motors Co. | 36.64 | 4.1 | 52,312.0 | 5.8 | 23.9 |
| GME | GameStop Corp. | 6.15 | 12.3 | 559.9 | -0.5 | -6.7 |
| GNE | Genie Energy Ltd. | 7.54 | 4.0 | 205.4 | 12.7 | 50.7 |
| GNL | Global Net Lease, Inc. | 19.41 | 11.0 | 1,639.9 | 159.5 | 1,750.2 |
| GOOD | Gladstone Commercial Corp. | 22.59 | 7.7 | 719.8 | 424.6 | 3,289.5 |
| GORO | Gold Resource Corp. | 3.96 | 0.6 | 259.7 | 89.2 | 52.5 |
| GPI | Group 1 Automotive, Inc. | 103.67 | 1.0 | 1,925.3 | ||
| GPN | Global Payments, Inc. | 162.20 | 0.0 | 48,667.6 | 52.7 | 1.3 |
| GPRE | Green Plains, Inc. | 12.12 | 3.0 | 462.8 | -10.3 | -30.6 |
| GRA | W.R. Grace & Co. | 67.16 | 2.0 | 4,482.0 | 20.1 | 39.4 |
| GRC | The Gorman-Rupp Co. | 36.97 | 8.4 | 966.1 | 26.2 | 221.1 |
| GRMN | Garmin Ltd. | 87.65 | 3.8 | 16,662.4 | 22.4 | 85.4 |
| GROW | U.S. Global Investors, Inc. | 2.05 | 1.7 | 31.0 | -9.2 | -15.6 |
| GS | The Goldman Sachs Group, Inc. | 217.75 | 2.3 | 78,294.8 | 9.6 | 21.9 |
| GSB | GlobalSCAPE, Inc. | 9.46 | 5.6 | 163.9 | ||
| GT | Goodyear Tire & Rubber Co. | 16.51 | 4.8 | 3,902.4 | 20.2 | 96.2 |
| GWRS | Global Water Resources, Inc. | 12.15 | 2.4 | 261.7 | 132.8 | 312.7 |
| GWW | W.W. Grainger, Inc. | 316.39 | 1.8 | 17,042.7 | 18.4 | 32.5 |
| H | Hyatt Hotels Corp. | 73.55 | 1.0 | 7,655.7 | 18.6 | 18.4 |
| HAL | Halliburton Co. | 20.30 | 3.5 | 17,819.4 | 15.0 | 53.0 |
| HAYN | Haynes International, Inc. | 34.73 | 2.5 | 434.6 | 75.4 | 191.0 |
| HBI | Hanesbrands, Inc. | 16.01 | 4.7 | 5,788.3 | 10.3 | 48.2 |
| HBM | HudBay Minerals, Inc. | 3.78 | 0.5 | 1,000.7 | -20.4 | -10.7 |
| HCA | HCA Healthcare, Inc. | 126.87 | 1.2 | 43,260.5 | 12.0 | 14.6 |
| HCAP | Harvest Capital Credit Corp. | 9.85 | 10.2 | 59.8 | 27.0 | 275.8 |
| HCC | Warrior Met Coal, Inc. | 22.85 | 20.4 | 1,177.4 | 1.8 | 36.8 |
| HCFT | Hunt Companies Finance Trust, Inc. | 3.33 | 8.4 | 78.9 | 35.6 | 299.1 |
| HCI | HCI Group, Inc. | 40.84 | 4.8 | 334.1 | 21.8 | 105.3 |
| HCP | HCP, Inc. | 36.15 | 5.1 | 17,753.6 | 17.5 | 89.7 |
| HCSG | Healthcare Services Group, Inc. | 25.67 | 3.8 | 1,902.5 | 24.7 | 94.9 |
| HD | The Home Depot, Inc. | 236.80 | 2.2 | 259,331.5 | 23.5 | 50.6 |
| HE | Hawaiian Electric Industries, Inc. | 44.51 | 2.8 | 4,863.5 | 23.8 | 67.7 |
| HEES | H&E Equipment Services, Inc. | 34.90 | 3.2 | 1,251.1 | 13.8 | 43.6 |
| HES | Hess Corp. | 66.57 | 1.5 | 20,269.3 | -416.1 | -625.0 |
| HFC | HollyFrontier Corp. | 58.25 | 2.3 | 9,586.7 | 10.8 | 24.4 |
| HGT | Hugoton Royalty Trust | 0.00 | 0.0 | 0.0 | ||
| HI | Hillenbrand, Inc. | 31.82 | 2.6 | 1,994.1 | 14.2 | 37.4 |
| HII | Huntington Ingalls Industries, Inc. | 222.69 | 1.5 | 9,204.9 | 13.8 | 21.3 |
| HIW | Highwoods Properties, Inc. | 45.65 | 5.2 | 4,735.9 | 37.1 | 191.8 |
| HL | Hecla Mining Co. | 2.07 | 0.5 | 1,034.4 | -8.3 | -3.9 |
| HLI | Houlihan Lokey, Inc. | 46.98 | 3.1 | 3,095.8 | 17.6 | 55.1 |
| HLT | Hilton Worldwide Holdings, Inc. | 97.19 | 0.8 | 27,423.4 | 30.3 | 23.4 |
| HMN | Horace Mann Educators Corp. | 44.95 | 2.6 | 1,844.4 | 15.9 | 40.7 |
| HNI | HNI Corp. | 38.64 | 3.1 | 1,656.7 | 17.5 | 54.5 |
| HNNA | Hennessy Advisors, Inc. | 11.18 | 4.2 | 83.8 | 7.1 | 29.9 |
| HOFT | Hooker Furniture Corp. | 23.17 | 2.6 | 274.4 | 9.1 | 23.5 |
| HOG | Harley-Davidson, Inc. | 40.35 | 3.7 | 6,324.1 | 15.6 | 57.7 |
| HOMB | Home Bancshares, Inc. (Arkansas) | 18.67 | 3.3 | 3,152.0 | 11.0 | 36.7 |
| HON | Honeywell International, Inc. | 172.68 | 2.4 | 123,385.6 | 19.9 | 48.2 |
| HP | Helmerich & Payne, Inc. | 39.64 | 9.0 | 4,338.0 | -58.0 | -519.7 |
| HPP | Hudson Pacific Properties, Inc. | 34.45 | 2.9 | 10,635.0 | 1,510.7 | 4,396.8 |
| HR | Healthcare Realty Trust, Inc. | 33.95 | 3.5 | 4,387.9 | 140.2 | 495.7 |
| HRC | Hill-Rom Holdings, Inc. | 98.58 | 0.8 | 6,716.3 | 30.6 | 25.3 |
| HRS | Harris Corp. | 189.13 | 1.4 | 22,341.2 | 24.9 | 34.6 |
| HSY | The Hershey Co. | 141.15 | 2.6 | 29,489.3 | 22.5 | 59.2 |
| HTGC | Hercules Capital, Inc. | 13.71 | 9.6 | 1,430.0 | 10.4 | 99.2 |
| HTLF | Heartland Financial USA, Inc. | 46.84 | 1.9 | 1,718.8 | ||
| HUBB | Hubbell, Inc. | 140.20 | 5.0 | 7,628.1 | 20.7 | 103.5 |
| HUN | Huntsman Corp. | 22.49 | 2.9 | 5,211.3 | 15.1 | 43.2 |
| HVT | Haverty Furniture Cos., Inc. | 21.09 | 8.3 | 415.6 | 15.8 | 130.0 |
| HWC | Hancock Whitney Corp. | 40.16 | 5.4 | 3,643.1 | 10.5 | 56.6 |
| HY | Hyster-Yale Materials Handling, Inc. | 52.23 | 2.4 | 668.0 | 25.7 | 61.7 |
| IBKR | Interactive Brokers Group, Inc. | 47.42 | 1.0 | 23,471.5 | 22.4 | 23.5 |
| IBM | International Business Machines Corp. | 135.97 | 4.7 | 120,452.4 | 15.7 | 73.7 |
| ICBK | County Bancorp, Inc. (Manitowoc, Wisconsin) | 22.27 | 1.0 | 149.8 | 9.7 | 9.6 |
| ICE | Intercontinental Exchange, Inc. | 91.60 | 1.5 | 51,334.0 | 25.7 | 37.6 |
| ICL | ICL-Israel Chemicals Ltd. | 4.54 | 16.8 | 5,889.6 | 11.4 | 192.1 |
| IDT | IDT Corp. | 7.06 | 0.0 | 187.1 | 11,766.7 | 0.0 |
| IIIN | Insteel Industries, Inc. | 19.79 | 0.6 | 381.2 | 68.0 | 41.2 |
| INTC | Intel Corp. | 56.76 | 2.7 | 246,906.0 | 13.1 | 36.1 |
| IP | International Paper Co. | 43.20 | 5.8 | 16,970.5 | 10.9 | 63.3 |
| IPG | Interpublic Group of Cos., Inc. | 22.17 | 4.1 | 8,596.0 | 13.1 | 53.9 |
| IPHS | Innophos Holdings, Inc. | 32.48 | 5.9 | 639.6 | 22.0 | 129.8 |
| IR | Ingersoll-Rand Plc | 122.08 | 2.2 | 29,491.7 | 20.9 | 45.4 |
| ITIC | Investors Title Co. | 168.97 | 7.2 | 319.2 | 13.9 | 100.6 |
| ITUB | Itaú Unibanco Holding SA | 9.19 | 8.1 | 44,356.7 | 13.2 | 106.8 |
| IVZ | Invesco Ltd. | 17.34 | 8.8 | 15,741.0 | 14.9 | 131.2 |
| JACK | Jack in the Box, Inc. | 83.50 | 1.9 | 2,156.3 | 24.2 | 46.4 |
| JBL | Jabil, Inc. | 37.14 | 1.1 | 5,654.4 | 20.3 | 21.9 |
| JBT | John Bean Technologies Corp. | 108.07 | 0.4 | 3,445.3 | 26.5 | 9.7 |
| JCOM | j2 Global, Inc. | 94.71 | 1.4 | 4,636.8 | 31.4 | 44.2 |
| JE | Just Energy Group, Inc. | 2.43 | 15.4 | 365.3 | -1.3 | -20.4 |
| JEC | Jacobs Engineering Group, Inc. | 94.41 | 0.7 | 12,792.4 | -53.7 | -38.7 |
| JKHY | Jack Henry & Associates, Inc. | 140.75 | 1.1 | 10,830.7 | 39.9 | 44.6 |
| JMP | JMP Group LLC | 3.35 | 6.6 | 64.7 | -95.4 | -626.8 |
| JNJ | Johnson & Johnson | 129.18 | 3.6 | 340,928.0 | ||
| JNPR | Juniper Networks, Inc. | 25.15 | 3.7 | 8,697.3 | 23.5 | 87.9 |
| JRVR | James River Group Holdings Ltd. | 35.11 | 3.4 | 1,065.3 | 14.2 | 48.6 |
| JWN | Nordstrom, Inc. | 38.04 | 3.9 | 5,893.0 | 12.5 | 48.5 |
| K | Kellogg Co. | 61.06 | 4.6 | 20,799.0 | 24.2 | 111.9 |
| KELYA | Kelly Services, Inc. | 24.13 | 1.2 | 949.9 | 8.3 | 10.2 |
| KEQU | Kewaunee Scientific Corp. | 15.21 | 5.0 | 41.8 | 70.4 | 351.5 |
| KEY | KeyCorp | 18.38 | 3.8 | 18,169.3 | 11.3 | 42.7 |
| KFRC | Kforce, Inc. | 39.55 | 1.8 | 959.3 | 18.3 | 33.3 |
| KHC | The Kraft Heinz Co. | 28.37 | 6.4 | 34,611.1 | -3.1 | -20.0 |
| KINS | Kingstone Cos., Inc. | 8.05 | 4.5 | 86.7 | -33.1 | -148.9 |
| KKR | KKR & Co., Inc. | 28.70 | 1.7 | 24,182.2 | 10.5 | 18.3 |
| KLAC | KLA Corp. | 174.78 | 1.7 | 27,696.2 | 23.1 | 39.7 |
| KMG | KMG Chemicals, Inc. | 0.00 | 0.0 | 0.0 | ||
| KMPR | Kemper Corp. | 73.58 | 1.3 | 4,917.1 | 12.8 | 17.1 |
| KNL | Knoll, Inc. | 26.40 | 2.4 | 1,314.1 | 15.8 | 38.2 |
| KNX | Knight-Swift Transportation Holdings, Inc. | 37.43 | 0.6 | 6,459.0 | 16.5 | 10.4 |
| KR | The Kroger Co. | 25.33 | 2.9 | 20,305.1 | 12.4 | 36.1 |
| KRNY | Kearny Financial Corp. | 13.74 | 1.7 | 1,203.6 | 29.2 | 48.9 |
| KRO | Kronos Worldwide, Inc. | 12.63 | 7.0 | 1,462.6 | 12.6 | 88.6 |
| KSS | Kohl's Corp. | 53.71 | 4.9 | 8,546.7 | 11.8 | 57.4 |
| L | Loews Corp. | 49.42 | 0.5 | 14,943.6 | 27.5 | 13.9 |
| LABL | Multi-Color Corp. | 50.01 | 0.3 | 1,027.4 | -35.7 | -10.7 |
| LAD | Lithia Motors, Inc. | 157.60 | 0.9 | 3,617.5 | 13.9 | 13.1 |
| LAMR | Lamar Advertising Co. | 81.25 | 4.7 | 8,135.5 | 22.5 | 105.6 |
| LANC | Lancaster Colony Corp. | 136.14 | 1.9 | 3,742.9 | 24.9 | 47.5 |
| LAND | Gladstone Land Corp. | 11.96 | 5.2 | 248.9 | ||
| LARK | Landmark Bancorp, Inc. (Kansas) | 22.90 | 3.5 | 100.2 | 9.8 | 34.1 |
| LB | L Brands, Inc. | 17.95 | 8.4 | 4,961.2 | 8.6 | 71.7 |
| LBY | Libbey, Inc. | 2.17 | 0.0 | 49.4 | -0.9 | 0.0 |
| LCNB | LCNB Corp. | 18.10 | 3.8 | 234.0 | 12.4 | 46.5 |
| LDOS | Leidos Holdings, Inc. | 80.81 | 3.3 | 11,621.1 | 18.0 | 59.3 |
| LEA | Lear Corp. | 123.57 | 2.4 | 7,459.6 | 9.0 | 21.5 |
| LFUS | Littelfuse, Inc. | 187.62 | 0.9 | 4,646.4 | 28.0 | 26.2 |
| LKSD | LSC Communications, Inc. | 1.14 | 68.4 | 38.2 | -0.2 | -15.3 |
| LLL | L3 Technologies, Inc. | 245.17 | 1.0 | 19,479.0 | 22.7 | 23.1 |
| LLY | Eli Lilly & Co. | 112.99 | 2.8 | 108,485.2 | 25.4 | 70.6 |
| LMT | Lockheed Martin Corp. | 371.84 | 3.0 | 104,885.3 | 17.5 | 52.9 |
| LOB | Live Oak Bancshares, Inc. | 18.71 | 0.6 | 747.9 | 34.7 | 22.4 |
| LPLA | LPL Financial Holdings, Inc. | 80.21 | 1.6 | 6,602.0 | 12.1 | 18.9 |
| LRCX | Lam Research Corp. | 281.25 | 1.6 | 40,745.0 | 19.9 | 31.4 |
| LSTR | Landstar System, Inc. | 117.96 | 0.7 | 4,674.7 | 19.2 | 14.1 |
| LTC | LTC Properties, Inc. | 51.16 | 5.2 | 2,033.7 | 19.1 | 99.1 |
| LUV | Southwest Airlines Co. | 57.64 | 1.2 | 30,982.5 | 12.9 | 15.2 |
| LVS | Las Vegas Sands Corp. | 62.40 | 6.1 | 48,034.8 | 25.3 | 155.5 |
| LW | Lamb Weston Holdings, Inc. | 76.03 | 1.3 | 11,105.2 | 23.4 | 30.5 |
| LYB | LyondellBasell Industries NV | 91.34 | 4.5 | 30,621.4 | 9.6 | 42.9 |
| LZB | La-Z-Boy, Inc. | 35.56 | 1.5 | 1,658.3 | 24.4 | 35.7 |
| MAC | Macerich Co. | 28.45 | 13.2 | 4,315.3 | 37.1 | 488.7 |
| MAIN | Main Street Capital Corp. | 43.10 | 7.8 | 2,721.1 | 16.8 | 131.7 |
| MANT | ManTech International Corp. | 69.20 | 1.5 | 2,778.6 | 31.5 | 48.0 |
| MAR | Marriott International, Inc. | 126.60 | 1.4 | 41,696.8 | 28.7 | 40.4 |
| MARPS | Marine Petroleum Trust | 2.22 | 14.5 | 4.4 | 7.0 | 101.3 |
| MATX | Matson, Inc. | 39.63 | 4.4 | 1,698.3 | 18.2 | 79.4 |
| MBCN | Middlefield Banc Corp. | 46.46 | 2.4 | 149.2 | 11.6 | 27.9 |
| MBFI | 0.00 | 0.0 | 0.0 | |||
| MBWM | Mercantile Bank Corp. | 35.06 | 5.9 | 572.6 | 12.1 | 71.1 |
| MC | Moelis & Co. | 32.05 | 10.0 | 2,327.8 | 13.3 | 133.5 |
| MCD | McDonald's Corp. | 191.78 | 3.1 | 145,646.2 | ||
| MCHP | Microchip Technology, Inc. | 95.59 | 1.5 | 22,754.6 | 60.9 | 93.1 |
| MCHX | Marchex, Inc. | 3.28 | 0.0 | 141.1 | -41.3 | 0.0 |
| MCO | Moody's Corp. | 216.29 | 1.1 | 40,922.1 | 33.1 | 37.4 |
| MCS | Marcus Corp. | 36.11 | 1.7 | 1,116.5 | ||
| MCY | Mercury General Corp. | 47.31 | 10.6 | 2,618.8 | 12.7 | 134.8 |
| MDP | Meredith Corp. | 37.74 | 6.0 | 1,707.0 | -53.5 | -321.9 |
| MEOH | Methanex Corp. | 37.90 | 3.6 | 2,959.5 | 7.8 | 27.8 |
| MET | MetLife, Inc. | 46.81 | 4.6 | 43,835.1 | 7.6 | 35.2 |
| MFC | Manulife Financial Corp. | 19.11 | 5.3 | 37,112.1 | 8.8 | 46.6 |
| MFSF | MutualFirst Financial, Inc. | 32.84 | 2.4 | 279.1 | 12.6 | 30.6 |
| MGA | Magna International, Inc. | 54.70 | 6.1 | 17,022.0 | 7.0 | 42.7 |
| MGEE | MGE Energy, Inc. | 75.91 | 2.3 | 2,631.6 | 30.8 | 69.7 |
| MGIC | Magic Software Enterprises Ltd. | 9.36 | 3.3 | 457.6 | 23.1 | 75.6 |
| MGM | MGM Resorts International | 28.55 | 1.8 | 14,886.7 | 81.4 | 145.4 |
| MGPI | MGP Ingredients, Inc. | 48.75 | 0.8 | 830.0 | 21.7 | 16.9 |
| MIC | Macquarie Infrastructure Corp. | 39.67 | 10.1 | 3,422.0 | 33.4 | 336.6 |
| MINI | Mobile Mini, Inc. | 38.59 | 2.8 | 1,718.9 | -284.0 | -793.7 |
| MIXT | MiX Telematics Ltd. | 12.81 | 1.9 | 289.0 | 16.1 | 30.4 |
| MKSI | MKS Instruments, Inc. | 113.93 | 0.7 | 6,251.1 | 36.7 | 25.6 |
| MLAB | Mesa Laboratories, Inc. | 227.97 | 0.4 | 993.5 | 112.7 | 39.6 |
| MLI | Mueller Industries, Inc. | 30.86 | 1.3 | 1,757.5 | 17.3 | 22.5 |
| MLM | Martin Marietta Materials, Inc. | 269.05 | 0.7 | 16,799.5 | 33.3 | 24.7 |
| MLR | Miller Industries, Inc. (Tennessee) | 34.50 | 2.1 | 393.3 | 10.1 | 21.1 |
| MMM | 3M Co. | 169.06 | 3.4 | 97,218.1 | 19.8 | 66.4 |
| MNDO | MIND C.T.I. Ltd. | 2.33 | 11.2 | 46.2 | 8.5 | 94.6 |
| MNR | Monmouth Real Estate Investment Corp. | 14.71 | 5.8 | 1,404.3 | -387.1 | -2,236.8 |
| MNRO | Monro, Inc. | 70.98 | 1.2 | 2,358.2 | ||
| MOFG | MidWestOne Financial Group, Inc. | 32.00 | 3.1 | 517.8 | 11.9 | 37.2 |
| MOS | The Mosaic Co. | 20.58 | 1.0 | 7,941.1 | 30.8 | 29.9 |
| MPC | Marathon Petroleum Corp. | 67.58 | 3.0 | 44,489.2 | 14.4 | 43.8 |
| MPX | Marine Products Corp. | 13.05 | 6.0 | 444.3 | 15.2 | 90.8 |
| MRO | Marathon Oil Corp. | 11.94 | 1.7 | 9,600.3 | 10.1 | 16.9 |
| MRTN | Marten Transport Ltd. | 22.56 | 3.4 | 1,223.9 | 20.2 | 68.9 |
| MSA | MSA Safety, Inc. | 117.39 | 2.8 | 4,547.5 | 34.9 | 97.4 |
| MSCI | MSCI, Inc. | 225.03 | 1.1 | 19,059.8 | 33.4 | 35.9 |
| MSEX | Middlesex Water Co. | 64.78 | 1.9 | 1,073.3 | 31.4 | 59.0 |
| MSFT | Microsoft Corp. | 144.19 | 1.6 | 1,099,998.1 | 26.9 | 43.8 |
| MTB | M&T Bank Corp. | 158.66 | 2.5 | 20,990.5 | 11.4 | 28.7 |
| MTEX | Mannatech, Inc. | 16.29 | 5.4 | 39.0 | -68.3 | -367.0 |
| MTRN | Materion Corp. | 57.29 | 0.9 | 1,168.9 | 77.7 | 73.2 |
| MTX | Minerals Technologies, Inc. | 53.18 | 0.5 | 1,874.1 | 12.4 | 5.8 |
| MUR | Murphy Oil Corp. | 19.42 | 6.3 | 3,196.3 | 10.1 | 64.2 |
| MXIM | Maxim Integrated Products, Inc. | 57.98 | 3.2 | 15,718.1 | 19.2 | 61.7 |
| NAO | Hermitage Offshore Services Ltd. | 3.47 | 8.6 | 65.0 | -0.1 | -1.0 |
| NAT | Nordic American Tankers Ltd. | 3.74 | 4.8 | 534.8 | -9.2 | -44.0 |
| NATI | National Instruments Corp. | 40.95 | 2.4 | 5,400.7 | 35.7 | 85.5 |
| NAVG | The Navigators Group, Inc. | 69.96 | 0.3 | 2,096.7 | 1,231.7 | 369.7 |
| NAVI | Navient Corp. | 13.94 | 4.6 | 3,080.7 | 6.7 | 30.5 |
| NBHC | National Bank Holdings Corp. | 34.74 | 2.1 | 1,082.8 | 13.8 | 28.7 |
| NBTB | NBT Bancorp, Inc. | 38.03 | 2.7 | 1,664.8 | 13.8 | 37.7 |
| NC | NACCO Industries, Inc. | 63.22 | 1.1 | 441.9 | 10.2 | 11.4 |
| NCMI | National CineMedia, Inc. | 8.59 | 7.9 | 2,001.8 | 18.7 | 148.4 |
| NDAQ | Nasdaq, Inc. | 98.73 | 2.3 | 16,259.6 | 30.9 | 71.8 |
| NDRO | Enduro Royalty Trust | 0.00 | 0.0 | 0.0 | ||
| NDSN | Nordson Corp. | 156.02 | 0.9 | 8,969.6 | 28.0 | 25.6 |
| NEE | NextEra Energy, Inc. | 233.23 | 2.6 | 113,997.2 | 34.8 | 91.1 |
| NEM | Newmont Goldcorp Corp. | 38.85 | 4.1 | 31,852.9 | -285.7 | -1,161.8 |
| NEWM | New Media Investment Group, Inc. | 9.37 | 20.3 | 566.7 | 628.9 | 12,751.7 |
| NEWT | Newtek Business Services Corp. | 21.94 | 12.1 | 420.4 | 11.0 | 133.1 |
| NHC | National HealthCare Corp. | 80.37 | 2.5 | 1,231.2 | 16.5 | 41.9 |
| NHTC | Natural Health Trends Corp. | 6.78 | 8.6 | 73.1 | 6.6 | 56.5 |
| NLSN | Nielsen Holdings Plc | 20.95 | 6.7 | 7,451.4 | -10.8 | -72.2 |
| NNA | Navios Maritime Acquisition Corp. | 8.14 | 11.3 | 1,163.1 | -1.6 | -18.2 |
| NNBR | NN, Inc. | 6.71 | 4.2 | 284.3 | -1.1 | -4.4 |
| NNI | Nelnet, Inc. | 61.47 | 1.2 | 2,439.3 | 19.1 | 22.4 |
| NOC | Northrop Grumman Corp. | 346.53 | 1.5 | 58,401.7 | 17.8 | 25.9 |
| NOV | National Oilwell Varco, Inc. | 20.96 | 1.0 | 8,088.4 | -1.5 | -1.4 |
| NP | Neenah, Inc. | 63.02 | 2.8 | 1,062.6 | 20.8 | 58.1 |
| NPK | National Presto Industries, Inc. | 83.83 | 7.2 | 586.4 | 16.8 | 120.3 |
| NPO | EnPro Industries, Inc. | 71.56 | 1.4 | 1,473.7 | 43.5 | 60.1 |
| NRE | NorthStar Realty Europe Corp. | 17.02 | 3.5 | 855.9 | 4.7 | 16.5 |
| NRIM | Northrim BanCorp, Inc. | 37.53 | 3.2 | 250.4 | 13.8 | 44.1 |
| NSA | National Storage Affiliates Trust | 34.78 | 3.6 | 3,213.5 | -146.1 | -521.0 |
| NSC | Norfolk Southern Corp. | 187.76 | 2.3 | 48,957.9 | 18.2 | 42.5 |
| NSP | Insperity, Inc. | 103.15 | 1.1 | 4,252.5 | 25.8 | 27.4 |
| NTES | NetEase, Inc. | 283.67 | 0.9 | 36,298.6 | 28.4 | 26.6 |
| NTRI | 0.00 | 0.0 | 0.0 | |||
| NUS | Nu Skin Enterprises, Inc. | 44.76 | 3.3 | 2,486.3 | 19.9 | 65.7 |
| NVDA | NVIDIA Corp. | 206.79 | 0.3 | 125,935.1 | 45.9 | 14.2 |
| NWE | NorthWestern Corp. | 72.64 | 3.1 | 3,664.2 | 17.0 | 53.3 |
| NWL | Newell Brands, Inc. | 19.48 | 3.5 | 8,247.8 | -1.2 | -4.3 |
| NX | Quanex Building Products Corp. | 18.99 | 1.7 | 629.7 | -65.5 | -110.4 |
| NXRT | NexPoint Residential Trust, Inc. | 47.48 | 2.3 | 1,138.0 | -63.4 | -147.0 |
| NXST | Nexstar Media Group, Inc. | 103.64 | 3.4 | 4,780.1 | 12.6 | 42.8 |
| NYLD | Clearway Energy, Inc. | 0.00 | 0.0 | 0.0 | ||
| O | Realty Income Corp. | 80.88 | 3.6 | 25,738.3 | 61.7 | 223.2 |
| OCSI | Oaktree Strategic Income Corp. | 8.11 | 7.6 | 239.0 | 19.4 | 148.1 |
| OCSL | Oaktree Specialty Lending Corp. | 5.17 | 7.4 | 728.8 | 5.0 | 36.8 |
| ODC | Oil-Dri Corp. of America | 33.73 | 3.6 | 256.6 | 18.6 | 67.3 |
| ODFL | Old Dominion Freight Line, Inc. | 187.37 | 0.4 | 14,990.8 | 24.0 | 10.4 |
| ODP | Office Depot, Inc. | 2.09 | 4.8 | 1,141.9 | 38.8 | 185.5 |
| OEC | Orion Engineered Carbons SA | 16.83 | 5.9 | 1,022.4 | 11.4 | 67.1 |
| OGS | ONE Gas, Inc. | 93.32 | 2.1 | 4,921.2 | 27.3 | 57.4 |
| OLBK | Old Line Bancshares, Inc. | 29.31 | 1.6 | 498.2 | 13.6 | 21.3 |
| OLED | Universal Display Corp. | 176.06 | 0.2 | 8,290.4 | 71.3 | 14.6 |
| OLN | Olin Corp. | 19.12 | 5.1 | 3,190.7 | 11.8 | 60.7 |
| OMI | Owens & Minor, Inc. | 7.24 | 1.1 | 455.8 | -1.5 | -1.7 |
| ONB | Old National Bancorp | 18.13 | 3.6 | 3,086.1 | 13.2 | 47.3 |
| OPOF | Old Point Financial Corp. | 24.10 | 2.0 | 125.4 | 17.2 | 33.6 |
| ORA | Ormat Technologies, Inc. | 74.26 | 0.6 | 3,788.2 | 42.5 | 24.6 |
| ORC | Orchid Island Capital, Inc. | 5.61 | 18.5 | 353.8 | -15.4 | -285.4 |
| ORI | Old Republic International Corp. | 22.24 | 8.1 | 6,743.2 | 9.9 | 79.6 |
| OSB | Norbord, Inc. | 28.60 | 11.0 | 2,336.6 | 28.7 | 315.8 |
| OTEX | Open Text Corp. | 40.30 | 3.8 | 10,889.6 | 37.9 | 143.4 |
| OTTR | Otter Tail Corp. | 55.01 | 2.5 | 2,186.9 | 27.5 | 69.4 |
| OUT | OUTFRONT Media, Inc. | 26.53 | 6.8 | 3,802.9 | 23.6 | 160.1 |
| OXSQ | Oxford Square Capital Corp. | 5.88 | 17.1 | 280.2 | -12.5 | -213.1 |
| PAAS | Pan American Silver Corp. | 16.06 | 0.9 | 3,399.9 | -79.7 | -68.7 |
| PAG | Penske Automotive Group, Inc. | 49.92 | 3.9 | 4,117.6 | 9.4 | 36.6 |
| PAHC | Phibro Animal Health Corp. | 23.18 | 2.1 | 937.7 | 17.1 | 35.5 |
| PBA | Pembina Pipeline Corp. | 35.45 | 6.6 | 18,132.7 | 15.4 | 101.8 |
| PBF | PBF Energy, Inc. | 32.88 | 3.6 | 3,954.1 | 166.2 | 604.8 |
| PBI | Pitney Bowes, Inc. | 5.37 | 6.3 | 909.2 | 5.9 | 37.3 |
| PBIP | Prudential Bancorp, Inc. | 17.62 | 3.7 | 156.6 | 16.6 | 61.2 |
| PBT | Permian Basin Royalty Trust | 4.05 | 12.3 | 188.8 | 8.2 | 100.8 |
| PCAR | PACCAR, Inc. | 77.51 | 4.6 | 26,795.2 | 11.1 | 50.8 |
| PCH | PotlatchDeltic Corp. | 43.01 | 3.7 | 2,889.7 | 63.0 | 234.5 |
| PDM | Piedmont Office Realty Trust, Inc. | 21.07 | 4.0 | 2,650.2 | 22.2 | 88.4 |
| PEBK | Peoples Bancorp of North Carolina, Inc. | 30.05 | 2.2 | 177.7 | 12.3 | 26.6 |
| PEG | Public Service Enterprise Group, Inc. | 62.19 | 3.0 | 31,445.5 | 21.4 | 64.1 |
| PEI | Pennsylvania Real Estate Investment Trust | 6.24 | 13.5 | 483.9 | -3.5 | -46.7 |
| PEP | PepsiCo, Inc. | 136.57 | 2.8 | 190,437.3 | 15.5 | 42.7 |
| PFBI | Premier Financial Bancorp, Inc. | 17.62 | 3.4 | 258.0 | 10.7 | 36.5 |
| PFE | Pfizer Inc. | 37.28 | 4.8 | 206,197.5 | 16.7 | 79.8 |
| PFG | Principal Financial Group, Inc. | 55.08 | 7.9 | 15,312.2 | 10.3 | 81.5 |
| PFIN | P&F Industries, Inc. | 6.65 | 3.0 | 20.9 | 3.5 | 10.4 |
| PFIS | Peoples Financial Services Corp. | 49.20 | 5.6 | 363.5 | 13.4 | 75.1 |
| PFLT | PennantPark Floating Rate Capital Ltd. | 11.51 | 9.9 | 446.3 | 29.6 | 293.6 |
| PH | Parker-Hannifin Corp. | 190.37 | 2.2 | 24,462.4 | 16.4 | 35.7 |
| PHX | Panhandle Oil & Gas, Inc. | 14.28 | 1.1 | 234.0 | 15.1 | 16.9 |
| PII | Polaris Industries Inc. | 100.95 | 3.0 | 6,175.4 | 19.6 | 59.0 |
| PKOH | Park-Ohio Holdings Corp. | 31.89 | 1.6 | 398.0 | 8.2 | 12.8 |
| PLD | Prologis, Inc. | 85.89 | 2.4 | 54,260.5 | 30.4 | 73.3 |
| PLOW | Douglas Dynamics, Inc. | 46.21 | 2.3 | 1,053.4 | 21.4 | 50.1 |
| PLT | Plantronics, Inc. | 39.46 | 1.5 | 1,561.7 | -7.9 | -12.1 |
| PMD | Psychemedics Corp. | 9.32 | 9.7 | 51.4 | 17.4 | 168.0 |
| PNW | Pinnacle West Capital Corp. | 92.23 | 4.0 | 10,357.8 | 20.6 | 83.2 |
| POOL | Pool Corp. | 199.77 | 1.0 | 7,966.0 | 30.6 | 30.6 |
| POPE | Pope Resources LP | 75.84 | 5.3 | 330.3 | 52.8 | 278.7 |
| POWI | Power Integrations, Inc. | 94.90 | 0.9 | 2,792.1 | 47.9 | 43.4 |
| POWL | Powell Industries, Inc. | 38.94 | 2.7 | 448.7 | 92.1 | 247.0 |
| PPG | PPG Industries, Inc. | 123.71 | 2.0 | 29,252.8 | 24.3 | 48.3 |
| PRGO | Perrigo Co. Plc | 53.99 | 1.5 | 7,345.6 | 83.8 | 124.2 |
| PRGS | Progress Software Corp. | 39.63 | 2.0 | 1,785.6 | 35.9 | 70.6 |
| PRI | Primerica, Inc. | 127.76 | 1.0 | 5,352.8 | 15.8 | 15.7 |
| PRK | Park National Corp. | 98.90 | 4.2 | 1,623.3 | 15.1 | 64.1 |
| PROV | Provident Financial Holdings, Inc. | 20.26 | 2.8 | 151.5 | 34.3 | 94.8 |
| PRU | Prudential Financial, Inc. | 93.12 | 4.2 | 37,434.2 | 9.3 | 39.1 |
| PSA | Public Storage | 232.60 | 3.4 | 40,611.5 | 27.7 | 95.4 |
| PSB | PS Business Parks, Inc. | 182.61 | 2.9 | 5,010.3 | 44.4 | 127.6 |
| PSX | Phillips 66 | 117.25 | 3.7 | 52,645.3 | 11.7 | 43.0 |
| PTEN | Patterson-UTI Energy, Inc. | 8.80 | 2.2 | 1,805.2 | -3.4 | -7.5 |
| PTVCA | Protective Insurance Corp. | 15.40 | 3.8 | 221.6 | -7.0 | -26.5 |
| PTVCB | Protective Insurance Corp. | 16.06 | 3.6 | 231.1 | -7.3 | -26.5 |
| PVH | PVH Corp. | 89.67 | 0.2 | 6,648.5 | 10.0 | 1.7 |
| PWOD | Penns Woods Bancorp, Inc. | 30.61 | 6.1 | 215.4 | 12.7 | 77.7 |
| PX | Praxair, Inc. | 0.00 | 0.0 | 0.0 | ||
| PZN | Pzena Investment Management, Inc. | 8.59 | 7.1 | 601.9 | 12.3 | 87.4 |
| QCOM | QUALCOMM, Inc. | 83.05 | 3.7 | 100,960.6 | 29.1 | 108.8 |
| QUAD | Quad/Graphics, Inc. | 10.84 | 11.1 | 572.3 | -15.5 | -171.4 |
| R | Ryder System, Inc. | 55.12 | 5.0 | 2,939.8 | 9.2 | 45.5 |
| RBA | Ritchie Bros. Auctioneers, Inc. | 40.68 | 1.8 | 4,364.8 | 33.8 | 61.8 |
| RCKY | Rocky Brands, Inc. | 28.01 | 1.9 | 207.4 | 13.0 | 24.1 |
| RDN | Radian Group Inc. | 24.83 | 0.0 | 5,049.5 | 8.5 | 0.3 |
| RE | Everest Re Group Ltd. | 247.02 | 2.3 | 10,063.6 | 24.1 | 54.7 |
| RECN | Resources Connection, Inc. | 14.62 | 4.6 | 468.2 | 15.1 | 69.4 |
| REG | Regency Centers Corp. | 68.08 | 2.6 | 11,431.1 | 39.8 | 102.5 |
| REIS | Reis, Inc. | 0.00 | 0.0 | 0.0 | ||
| RES | RPC, Inc. | 4.49 | 7.1 | 965.6 | -18.7 | -132.9 |
| RGA | Reinsurance Group of America, Inc. | 160.03 | 1.6 | 10,001.0 | 12.9 | 20.2 |
| RGR | Sturm, Ruger & Co., Inc. | 45.57 | 2.0 | 796.1 | 19.5 | 39.2 |
| RHI | Robert Half International, Inc. | 59.19 | 2.0 | 6,958.4 | 15.2 | 31.1 |
| RICK | RCI Hospitality Holdings, Inc. | 19.30 | 0.7 | 185.6 | 11.6 | 7.8 |
| RLI | RLI Corp. | 96.78 | 2.0 | 4,339.2 | 36.8 | 72.2 |
| RMAX | RE/MAX Holdings, Inc. | 34.86 | 2.4 | 621.7 | 22.6 | 53.8 |
| RMCF | Rocky Mountain Chocolate Factory, Inc. | 9.04 | 5.3 | 54.2 | 20.8 | 110.5 |
| RMD | ResMed, Inc. | 145.45 | 1.3 | 20,913.7 | 49.8 | 64.7 |
| RNR | RenaissanceRe Holdings Ltd. | 182.78 | 0.7 | 8,071.9 | 13.5 | 10.0 |
| RNST | Renasant Corp. | 35.03 | 2.5 | 2,012.6 | 11.8 | 28.9 |
| ROIC | Retail Opportunity Investments Corp. | 18.35 | 4.2 | 2,142.2 | 42.4 | 177.9 |
| ROK | Rockwell Automation, Inc. | 176.74 | 2.2 | 20,680.0 | 20.5 | 44.9 |
| ROL | Rollins, Inc. | 38.00 | 2.0 | 12,444.5 | 61.1 | 120.7 |
| ROST | Ross Stores, Inc. | 109.39 | 0.9 | 39,569.6 | 24.7 | 22.3 |
| ROYT | Pacific Coast Oil Trust | 1.32 | 19.3 | 50.9 | 4.0 | 78.0 |
| RRC | Range Resources Corp. | 4.20 | 1.9 | 1,051.0 | -0.6 | -1.2 |
| RRD | R.R. Donnelley & Sons Co. | 4.46 | 3.3 | 320.7 | -83.4 | -276.0 |
| RRR | Red Rock Resorts, Inc. | 21.33 | 3.7 | 2,515.4 | 47.5 | 177.1 |
| RS | Reliance Steel & Aluminum Co. | 118.57 | 2.3 | 7,873.4 | 12.8 | 29.2 |
| RUTH | Ruth's Hospitality Group, Inc. | 20.72 | 2.4 | 622.8 | 14.6 | 35.3 |
| RWT | Redwood Trust, Inc. | 16.62 | 7.2 | 1,862.9 | 12.2 | 87.9 |
| RYAM | Rayonier Advanced Materials, Inc. | 4.18 | 4.9 | 269.4 | -160.8 | -792.5 |
| RYN | Rayonier, Inc. | 29.19 | 4.6 | 3,783.9 | 54.7 | 252.9 |
| SABR | Sabre Corp. | 22.17 | 2.5 | 6,042.8 | 25.2 | 63.9 |
| SAFT | Safety Insurance Group, Inc. | 99.84 | 3.3 | 1,535.9 | 14.7 | 48.7 |
| SALM | Salem Media Group, Inc. | 1.55 | 16.8 | 32.6 | -7.9 | -132.8 |
| SAMG | Silvercrest Asset Management Group, Inc. | 12.20 | 4.8 | 164.2 | 11.9 | 57.7 |
| SBFG | SB Financial Group, Inc. | 16.65 | 2.7 | 106.8 | 10.9 | 29.0 |
| SBGI | Sinclair Broadcast Group, Inc. | 42.15 | 1.9 | 3,897.3 | 12.3 | 23.2 |
| SBR | Sabine Royalty Trust | 38.15 | 9.5 | 556.2 | 11.1 | 104.9 |
| SBSI | Southside Bancshares, Inc. | 35.09 | 3.5 | 1,184.3 | 16.0 | 56.4 |
| SCHL | Scholastic Corp. | 37.93 | 2.0 | 1,318.1 | 75.3 | 148.8 |
| SCI | Service Corp. International | 46.01 | 1.5 | 8,355.8 | 20.2 | 31.3 |
| SCL | Stepan Co. | 98.49 | 1.3 | 2,221.6 | 21.0 | 27.2 |
| SEB | Seaboard Corp. | 4,266.99 | 0.2 | 4,966.4 | 84.2 | 16.3 |
| SEE | Sealed Air Corp. | 42.04 | 2.3 | 6,496.3 | 18.0 | 41.0 |
| SELF | Global Self Storage, Inc. | 4.61 | 5.6 | 35.6 | 72.0 | 406.3 |
| SEMG | SemGroup Corp. | 15.90 | 11.9 | 1,251.1 | -18.4 | -219.1 |
| SF | Stifel Financial Corp. | 57.72 | 1.0 | 4,016.4 | 10.0 | 9.9 |
| SFL | SFL Corp Ltd | 14.84 | 9.4 | 1,596.9 | 17.3 | 163.5 |
| SGA | Saga Communications, Inc. | 30.22 | 4.8 | 179.7 | 12.7 | 61.2 |
| SGB | Southwest Georgia Financial Corp. | 20.31 | 2.4 | 51.7 | 10.1 | 23.9 |
| SHOO | Steven Madden Ltd. | 39.60 | 1.6 | 3,043.1 | 23.0 | 36.0 |
| SHW | The Sherwin-Williams Co. | 578.24 | 0.9 | 53,376.8 | 38.1 | 35.5 |
| SIG | Signet Jewelers Ltd. | 17.75 | 10.4 | 927.7 | -4.2 | -44.0 |
| SIGI | Selective Insurance Group, Inc. | 71.90 | 1.1 | 4,256.8 | 18.1 | 20.2 |
| SIX | Six Flags Entertainment Corp. | 43.50 | 7.5 | 3,676.8 | 13.6 | 102.6 |
| SJM | The J. M. Smucker Co. | 106.98 | 6.5 | 12,200.9 | 22.7 | 147.6 |
| SJR | Shaw Communications, Inc. | 20.11 | 7.9 | 10,393.3 | 18.7 | 147.3 |
| SJT | San Juan Basin Royalty Trust | 2.58 | 12.0 | 120.3 | 7.0 | 83.6 |
| SJW | SJW Group | 72.60 | 1.6 | 2,064.9 | 39.6 | 64.3 |
| SLF | Sun Life Financial, Inc. | 45.19 | 4.5 | 26,715.0 | 15.2 | 68.8 |
| SLGN | Silgan Holdings, Inc. | 31.07 | 1.4 | 3,454.2 | 17.5 | 24.2 |
| SMG | Scotts Miracle-Gro Co. | 97.45 | 2.3 | 5,420.9 | 14.6 | 33.4 |
| SMMF | Summit Financial Group, Inc. (West Virginia) | 26.26 | 2.2 | 325.7 | 10.5 | 23.3 |
| SMP | Standard Motor Products, Inc. | 51.43 | 1.8 | 1,143.1 | 22.7 | 39.9 |
| SNA | Snap-On, Inc. | 166.33 | 2.3 | 9,122.5 | 13.2 | 30.2 |
| SNR | New Senior Investment Group, Inc. | 7.01 | 7.4 | 582.7 | -4.5 | -33.1 |
| SO | The Southern Co. | 61.01 | 5.0 | 63,769.5 | 14.3 | 71.5 |
| SON | Sonoco Products Co. | 58.73 | 3.6 | 5,877.5 | ||
| SPGI | S&P Global, Inc. | 248.59 | 0.9 | 61,227.7 | 31.3 | 27.8 |
| SPKE | Spark Energy, Inc. | 9.62 | 9.4 | 339.4 | -12.7 | -119.8 |
| SPOK | Spok Holdings, Inc. | 11.71 | 5.3 | 220.8 | -209.1 | -1,116.1 |
| SPTN | SpartanNash Co. | 13.80 | 5.4 | 501.4 | 111.6 | 606.3 |
| SSI | Stage Stores, Inc. | 2.41 | 2.1 | 69.6 | -0.6 | -1.3 |
| SSL | Sasol Ltd. | 20.28 | 2.0 | 12,669.2 | 10.6 | 21.3 |
| SSNC | SS&C Technologies Holdings, Inc. | 51.46 | 0.7 | 13,134.6 | 40.3 | 29.6 |
| SSP | The E.W. Scripps Co. | 13.99 | 1.4 | 1,140.3 | 34.3 | 48.7 |
| STAG | STAG Industrial, Inc. | 30.92 | 5.8 | 4,233.8 | ||
| STBZ | State Bank Financial Corporation | 0.00 | 0.0 | 0.0 | ||
| STC | Stewart Information Services Corp. | 39.79 | 3.0 | 943.5 | ||
| STE | STERIS Plc (Ireland) | 139.54 | 1.0 | 11,810.4 | 37.0 | 36.9 |
| STFC | State Auto Financial Corp. | 33.90 | 1.2 | 1,476.1 | 28.1 | 33.2 |
| STI | SunTrust Banks, Inc. | 69.57 | 3.0 | 30,891.4 | 12.7 | 37.5 |
| STM | STMicroelectronics NV | 23.26 | 1.6 | 20,469.7 | 18.6 | 29.2 |
| STNG | Scorpio Tankers, Inc. | 32.43 | 0.9 | 1,701.0 | -10.8 | -10.2 |
| STRA | Strategic Education, Inc. | 128.09 | 1.6 | 2,824.6 | -498.2 | -774.4 |
| STRT | STRATTEC Security Corp. | 21.99 | 3.2 | 83.7 | -4.2 | -13.4 |
| SU | Suncor Energy, Inc. | 30.15 | 6.7 | 47,322.0 | 11.1 | 74.2 |
| SWK | Stanley Black & Decker, Inc. | 152.09 | 2.2 | 23,078.6 | 32.7 | 72.2 |
| SWKS | Skyworks Solutions, Inc. | 91.66 | 1.7 | 15,738.3 | 17.4 | 29.9 |
| SWM | Schweitzer-Mauduit International, Inc. | 40.53 | 4.4 | 1,249.7 | 14.5 | 63.1 |
| SWX | Southwest Gas Holdings, Inc. | 86.42 | 3.1 | 4,694.7 | 22.8 | 70.5 |
| SXT | Sensient Technologies Corp. | 62.42 | 2.9 | 2,641.6 | 20.0 | 58.6 |
| SYMC | Symantec Corp. | 22.85 | 1.3 | 14,122.0 | 123.7 | 162.4 |
| SYX | Systemax, Inc. | 24.58 | 28.4 | 921.4 | 24.6 | 698.9 |
| TACT | TransAct Technologies, Inc. | 11.61 | 3.1 | 86.7 | 19.3 | 59.8 |
| TAP | Molson Coors Brewing Co. | 54.57 | 3.3 | 11,803.0 | 13.2 | 43.5 |
| TCBK | TriCo Bancshares | 36.96 | 2.1 | 1,127.6 | 13.2 | 28.1 |
| TCO | Taubman Centers, Inc. | 38.40 | 7.0 | 2,350.4 | 51.9 | 362.3 |
| TDS | Telephone & Data Systems, Inc. | 26.38 | 2.5 | 3,020.8 | 19.4 | 48.2 |
| TECH | Bio-Techne Corp. | 210.49 | 0.6 | 7,963.0 | 82.9 | 50.7 |
| TECK | Teck Resources Ltd. | 16.78 | 1.8 | 9,436.7 | 7.6 | 13.3 |
| TEL | TE Connectivity Ltd. | 94.56 | 1.9 | 31,766.0 | 10.1 | 19.2 |
| TEN | Tenneco, Inc. | 14.87 | 3.4 | 1,200.1 | -10.6 | -35.8 |
| TEO | Telecom Argentina SA | 9.15 | 14.3 | 1,156.1 | 10.8 | 154.5 |
| TER | Teradyne, Inc. | 64.33 | 0.6 | 10,886.7 | 23.0 | 12.9 |
| TERP | TerraForm Power, Inc. | 16.46 | 4.8 | 3,739.4 | -56.1 | -270.7 |
| TEX | Terex Corp. | 29.13 | 1.8 | 2,080.5 | 561.2 | 1,037.1 |
| TFSL | TFS Financial Corp. | 19.08 | 5.3 | 5,342.0 | 66.0 | 352.8 |
| TFX | Teleflex, Inc. | 327.34 | 0.4 | 15,133.9 | 55.5 | 23.1 |
| TGI | Triumph Group, Inc. | 20.62 | 0.8 | 1,032.2 | -4.5 | -3.5 |
| TGT | Target Corp. | 109.72 | 3.0 | 56,059.1 | 18.0 | 53.2 |
| THG | The Hanover Insurance Group, Inc. | 126.14 | 5.7 | 4,989.3 | 17.1 | 97.2 |
| TIER | TIER REIT, Inc. | 28.88 | 1.2 | 1,603.4 | -56.4 | -70.3 |
| TILE | Interface, Inc. | 16.90 | 1.9 | 985.8 | 14.4 | 27.8 |
| TIVO | TiVo Corp. | 7.95 | 6.4 | 1,018.8 | -2.8 | -18.2 |
| TJX | The TJX Cos., Inc. | 58.34 | 1.9 | 70,747.2 | 23.2 | 42.9 |
| TKR | The Timken Co. | 48.04 | 2.3 | 3,660.7 | 11.6 | 27.0 |
| TLRD | Tailored Brands, Inc. | 5.08 | 14.2 | 257.3 | 4.2 | 58.9 |
| TNC | Tennant Co. | 70.32 | 1.3 | 1,280.2 | 33.8 | 42.2 |
| TNK | Teekay Tankers Ltd. | 2.13 | 0.0 | 586.4 | -73.2 | 0.0 |
| TPL | Texas Pacific Land Trust | 608.30 | 1.0 | 4,746.0 | 15.6 | 15.3 |
| TR | Tootsie Roll Industries, Inc. | 33.58 | 1.1 | 2,200.7 | 35.2 | 37.8 |
| TRCO | Tribune Media Co. | 46.66 | 2.1 | 4,125.2 | 11.3 | 24.2 |
| TRI | Thomson Reuters Corp. | 66.75 | 4.3 | 33,236.7 | 68.8 | 298.1 |
| TRK | Speedway Motorsports LLC | 19.78 | 3.0 | 808.1 | 21.5 | 65.2 |
| TRMK | Trustmark Corp. | 34.74 | 3.3 | 2,232.5 | 14.8 | 49.0 |
| TROW | T. Rowe Price Group, Inc. | 117.08 | 2.5 | 27,358.9 | 14.7 | 37.3 |
| TROX | Tronox Holdings Plc | 8.65 | 2.1 | 1,227.3 | -12.8 | -26.6 |
| TRTN | Triton International Ltd. | 36.92 | 7.0 | 2,667.0 | 8.4 | 59.5 |
| TRV | The Travelers Cos., Inc. | 129.30 | 3.1 | 33,374.0 | 14.4 | 44.6 |
| TSCO | Tractor Supply Co. | 95.71 | 1.4 | 11,414.9 | 20.8 | 28.7 |
| TSLX | TPG Specialty Lending, Inc. | 21.23 | 8.4 | 1,406.9 | 10.1 | 84.5 |
| TSN | Tyson Foods, Inc. | 82.08 | 2.3 | 24,187.0 | 13.4 | 30.5 |
| TTEK | Tetra Tech, Inc. | 88.27 | 0.6 | 4,837.5 | 27.7 | 16.9 |
| TXRH | Texas Roadhouse, Inc. | 57.38 | 2.3 | 3,490.5 | 25.2 | 57.7 |
| UBCP | United Bancorp, Inc. (Ohio) | 11.83 | 4.9 | 70.0 | 12.1 | 59.7 |
| UBOH | United Bancshares, Inc. (Ohio) | 20.51 | 3.1 | 67.1 | 7.5 | 23.4 |
| UCBA | United Community Bancorp | 0.00 | 0.0 | 0.0 | ||
| UE | Urban Edge Properties | 21.15 | 4.2 | 2,564.0 | 29.8 | 123.9 |
| UFAB | Unique Fabricating, Inc. | 2.60 | 7.7 | 25.4 | -3.4 | -26.5 |
| UFCS | United Fire Group, Inc. | 45.50 | 2.8 | 1,149.2 | 51.9 | 146.0 |
| UGP | Ultrapar Participaçoes SA | 4.78 | 4.8 | 5,245.5 | 16.9 | 80.6 |
| UHS | Universal Health Services, Inc. | 138.08 | 0.4 | 12,218.6 | 17.1 | 6.2 |
| UIHC | United Insurance Holdings Corp. | 12.13 | 2.0 | 524.4 | -31.9 | -63.2 |
| UL | Unilever Plc | 58.99 | 3.8 | 68,478.8 | 14.6 | 56.1 |
| ULH | Universal Logistics Holdings, Inc. | 18.55 | 4.0 | 506.1 | 13.9 | 55.5 |
| UMH | UMH Properties, Inc. | 14.68 | 7.4 | 593.5 | -12.6 | -92.8 |
| UN | Unilever NV | 58.19 | 3.9 | 84,426.8 | 14.4 | 56.0 |
| UNF | UniFirst Corp. | 205.18 | 0.2 | 3,912.2 | 21.0 | 4.6 |
| UNH | UnitedHealth Group, Inc. | 247.05 | 1.6 | 234,124.6 | ||
| UNP | Union Pacific Corp. | 170.75 | 2.1 | 118,534.7 | 20.0 | 41.4 |
| UNTY | Unity Bancorp, Inc. | 21.19 | 1.4 | 230.3 | 9.8 | 13.9 |
| UPS | United Parcel Service, Inc. | 116.25 | 3.3 | 99,742.5 | 20.1 | 65.6 |
| USLM | United States Lime & Minerals, Inc. | 84.60 | 0.6 | 474.8 | 23.8 | 15.2 |
| UTX | United Technologies Corp. | 143.04 | 2.6 | 123,457.5 | 23.9 | 61.5 |
| UVE | Universal Insurance Holdings, Inc. | 29.06 | 2.6 | 992.7 | 9.3 | 24.6 |
| V | Visa, Inc. | 179.84 | 0.7 | 312,633.8 | 34.5 | 24.9 |
| VAC | Marriott Vacations Worldwide Corp. | 110.07 | 1.6 | 4,791.0 | 135.7 | 222.0 |
| VALE | Vale SA | 12.14 | 0.0 | 62,719.0 | 18.0 | 0.0 |
| VALU | Value Line, Inc. | 23.28 | 3.4 | 224.9 | 19.2 | 65.1 |
| VEDL | Vedanta Ltd. | 8.37 | 12.8 | 7,778.2 | 8.0 | 101.7 |
| VET | Vermilion Energy, Inc. | 15.43 | 19.4 | 2,394.1 | 8.9 | 172.6 |
| VFC | VF Corp. | 83.45 | 4.6 | 33,227.9 | 25.7 | 119.3 |
| VGR | Vector Group Ltd. | 12.23 | 13.1 | 1,807.5 | 22.9 | 299.3 |
| VHI | Valhi, Inc. | 1.89 | 4.3 | 637.8 | 3.4 | 14.4 |
| VIRT | Virtu Financial, Inc. | 17.18 | 5.6 | 3,274.7 | 35.1 | 196.3 |
| VLO | Valero Energy Corp. | 100.07 | 3.5 | 41,469.3 | 18.0 | 63.1 |
| VMC | Vulcan Materials Co. | 145.71 | 1.0 | 19,275.5 | 34.2 | 35.7 |
| VOYA | Voya Financial, Inc. | 55.15 | 0.3 | 7,722.6 | 13.0 | 4.3 |
| VSH | Vishay Intertechnology, Inc. | 19.75 | 1.9 | 2,721.4 | 9.5 | 18.2 |
| VVC | Vectren Corporation | 0.00 | 0.0 | 0.0 | ||
| VVV | Valvoline, Inc. | 21.47 | 2.0 | 4,049.8 | 18.0 | 35.4 |
| WBA | Walgreens Boots Alliance, Inc. | 55.80 | 4.0 | 50,395.4 | 12.9 | 51.8 |
| WCN | Waste Connections, Inc. | 91.93 | 0.7 | 23,716.8 | 43.5 | 31.0 |
| WEBK | Wellesley Bancorp, Inc. | 32.00 | 0.7 | 81.9 | 12.2 | 8.8 |
| WEC | WEC Energy Group, Inc. | 92.53 | 3.1 | 29,187.3 | 26.7 | 83.9 |
| WEN | The Wendy's Co. | 21.00 | 2.4 | 4,820.2 | 10.5 | 25.3 |
| WEYS | Weyco Group, Inc. | 24.79 | 3.8 | 247.4 | 11.7 | 44.4 |
| WFC | Wells Fargo & Co. | 51.65 | 4.5 | 220,499.0 | 11.1 | 50.4 |
| WHR | Whirlpool Corp. | 154.54 | 3.8 | 9,766.9 | 9.3 | 35.4 |
| WINA | Winmark Corp. | 182.80 | 0.6 | 700.3 | 22.4 | 12.9 |
| WLK | Westlake Chemical Corp. | 65.31 | 1.6 | 8,377.2 | 13.6 | 21.1 |
| WM | Waste Management, Inc. | 111.28 | 1.8 | 47,209.5 | 26.9 | 48.4 |
| WMB | The Williams Cos., Inc. | 22.97 | 6.4 | 27,840.1 | 302.6 | 1,949.9 |
| WMS | Advanced Drainage Systems, Inc. | 36.79 | 3.6 | 2,508.9 | -11.0 | -40.1 |
| WOR | Worthington Industries, Inc. | 37.61 | 3.1 | 2,103.3 | 22.8 | 70.8 |
| WPG | Washington Prime Group, Inc. | 4.36 | 22.9 | 813.6 | 28.5 | 653.2 |
| WRE | Washington Real Estate Investment Trust | 30.06 | 5.0 | 2,415.3 | 7.2 | 35.7 |
| WRI | Weingarten Realty Investors | 29.60 | 10.1 | 3,808.6 | 17.3 | 174.2 |
| WSR | Whitestone REIT | 14.08 | 9.4 | 566.5 | 30.9 | 292.1 |
| WSTG | Wayside Technology Group, Inc. | 14.31 | 4.8 | 64.5 | 10.1 | 48.1 |
| WTM | White Mountains Insurance Group Ltd. | 1,055.38 | 0.1 | 3,371.1 | 14.7 | 1.4 |
| WTR | Aqua America, Inc. | 44.90 | 2.0 | 9,688.4 | 58.7 | 116.6 |
| WTS | Watts Water Technologies, Inc. | 93.12 | 0.9 | 3,172.9 | 24.9 | 23.4 |
| WU | The Western Union Co. | 25.02 | 3.2 | 10,605.8 | 9.0 | 28.5 |
| WWD | Woodward, Inc. | 107.68 | 0.7 | 6,670.1 | 24.9 | 18.3 |
| WWE | World Wrestling Entertainment, Inc. | 68.57 | 0.9 | 5,420.5 | 69.7 | 60.7 |
| WY | Weyerhaeuser Co. | 29.37 | 4.6 | 21,878.6 | -145.0 | -671.3 |
| WYND | Wyndham Destinations, Inc. | 46.35 | 3.8 | 4,269.8 | 10.2 | 38.9 |
| X | United States Steel Corp. | 12.29 | 1.6 | 2,101.8 | 2.2 | 3.5 |
| XEC | Cimarex Energy Co. | 44.57 | 2.2 | 4,521.9 | 7.2 | 15.5 |
| XIN | Xinyuan Real Estate Co. Ltd. | 4.01 | 10.0 | 240.2 | 2.0 | 20.0 |
| XOM | Exxon Mobil Corp. | 68.64 | 4.9 | 290,423.4 | 16.5 | 81.4 |
| XYL | Xylem, Inc. | 84.03 | 1.4 | 15,127.8 | 26.4 | 36.7 |
| Y | Alleghany Corp. | 749.12 | 0.0 | 10,753.7 | 34.6 | 0.0 |
| YUM | Yum! Brands, Inc. | 109.51 | 1.5 | 33,322.4 | 25.5 | 37.8 |
| ZEUS | Olympic Steel, Inc. | 15.17 | 0.5 | 167.8 | 12.0 | 6.2 |
| ZTS | Zoetis, Inc. | 125.13 | 0.6 | 59,756.8 | 43.7 | 27.3 |
| Ticker | Name | Price | Dividend Yield | Market Cap ($M) | P/E Ratio | Payout Ratio |
Keep reading this article to learn more about how to use the list of stocks that pay dividends in March to find investment ideas.
How To Use The March Dividend Stocks List To Find Investment Ideas
Having an Excel database that contains every stock that pays dividends in March is very useful for the income-oriented investor.
This document becomes even more useful when combined with a working knowledge of Microsoft Excel.
With that in mind, this tutorial will show you how to implement two additional investing screens to the stocks in the March dividend stocks database.
The first screen that we’ll implement is for stocks that trade with low price-to-earnings multiples and above-average dividend yields.
Screen 1: Price-to-Earnings Below 15, Dividends Yields Above 3%
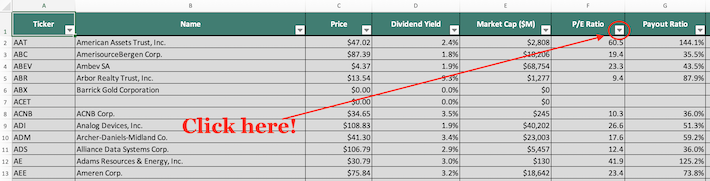
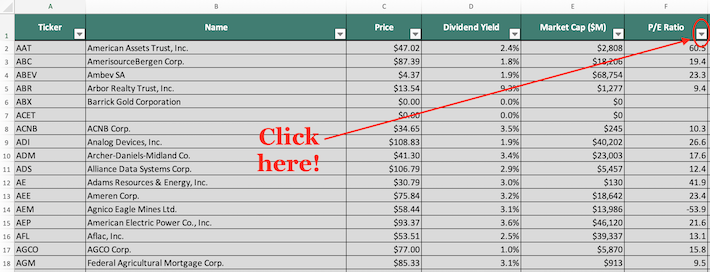
Step 1: Download your free list of stocks that pay dividends in March by clicking here. Apply Excel’s filter function to every column in the spreadsheet.
Step 2: Click the filter icon at the top of the price-to-earnings ratio column, as shown below.
Step 3: Change the filter setting to “Less Than” and input 15 into the field beside it, as shown below. 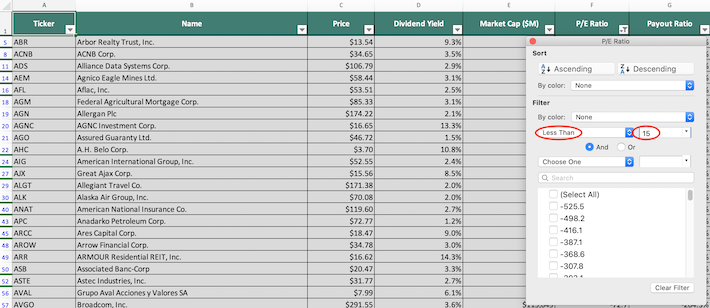
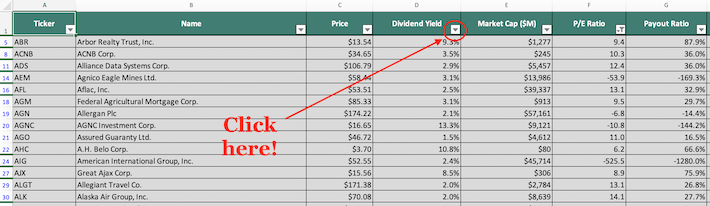
Step 4: Close out of the filter window (by clicking the exit button, not by clicking the “Clear Filter” button in the bottom right corner). Then, click on the filter button at the top of the dividend yield column, as shown below.
Step 5: Change the filter setting to “Greater Than” and input 0.03 into the field beside it, as shown below. Note that since dividend yield is measured in percentage points, filtering for stocks with a dividend yield above “0.03” is equivalent to filtering for stocks with dividend yields above 3%.
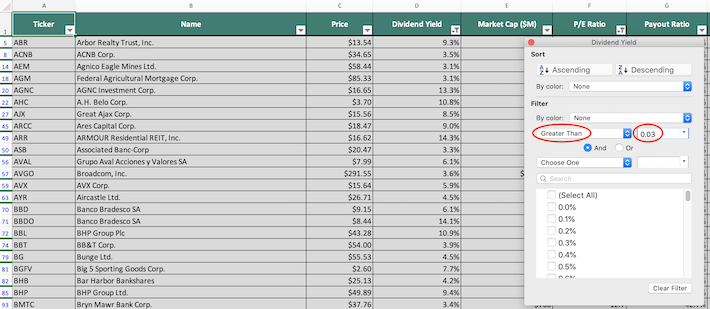
The remaining stocks in this spreadsheet are stocks that pay dividends in March that have price-to-earnings ratios below 15 and dividend yields above 3%.
The next screen that we’ll demonstrate how to implement is for small- and mid-cap value stocks. More specifically, the filter will look for stocks that pay dividends in March with price-to-earnings ratios below 12 and market capitalizations below $10 billion.
Screen 2: Price-to-Earnings Ratios Below 12, Market Capitalizations Below $10 Billion
Step 1: Download your free list of stocks that pay dividends in March by clicking here. Apply Excel’s filter function to every column in the spreadsheet.
Step 2: Click the filter icon at the top of the price-to-earnings ratio column, as shown below.
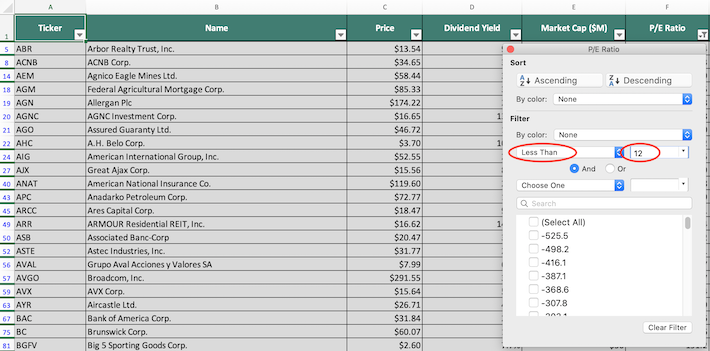
Step 3: Change the filter setting to “Less Than” and input 12 into the field beside it, as shown below. This will filter for stocks that pay dividends in March with price-to-earnings ratios less than 12.
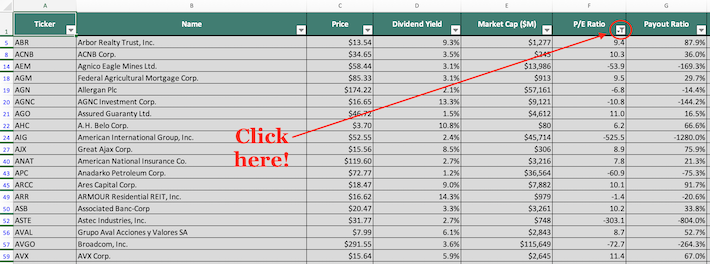
Step 4: Close out of the filter window (by clicking the exit button, not by clicking the “Clear Filter” button in the bottom right corner). Next, click the filter icon at the top of the market capitalization column, as shown below.
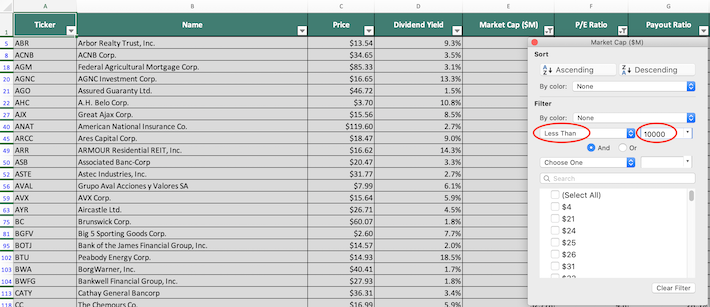
Step 5: Change the filter setting to “Less Than” and input 10000 into the field beside it, as shown below. Since market capitalization is measured in millions of dollars in this spreadsheet, filtering for stocks with market capitalizations below “$10,000 million” is equivalent to screening for securities with aggregate capitalizations below $10 billion.
You now have a solid, fundamental understanding of how to use the March dividend stocks list to find investment ideas.
The remainder of this article will introduce other investing resources that have the ability to improve your long-term investing outcomes.
Final Thoughts: Other Useful Investing Resources
Having an Excel document that contains the name, tickers, and financial information for all stocks that pay dividends in March is quite useful – but it becomes far more useful when combined with other databases for the non-March months of the calendar year.
Fortunately, Sure Dividend also maintains similar databases for the other 11 months of the year. You can access these databases below:
- The Complete List of Stocks That Pay Dividends in January
- The Complete List of Stocks That Pay Dividends in February
- The Complete List of Stocks That Pay Dividends in April
- The Complete List of Stocks That Pay Dividends in May
- The Complete List of Stocks That Pay Dividends in June
- The Complete List of Stocks That Pay Dividends in July
- The Complete List of Stocks That Pay Dividends in August
- The Complete List of Stocks That Pay Dividends in September
- The Complete List of Stocks That Pay Dividends in October
- The Complete List of Stocks That Pay Dividends in November
- The Complete List of Stocks That Pay Dividends in December
Having a database of every stock that pays dividends in March allows you to diversify your dividend income based on which month it is paid.
However, this is not all the diversification that an investor really needs. They should also be diversified by sector.
With this in mind, Sure Dividend maintains sector-specific stock market databases which you can download (for free) at the links below:
- The Complete List of Dividend-Paying Industrial Stocks
- The Complete List of Dividend-Paying Telecommunications Stocks
- The Complete List of Dividend-Paying Materials Stocks
- The Complete List of Dividend-Paying Utility Stocks
- The Complete List of Dividend-Paying Consumer Staples Stocks
- The Complete List of Dividend-Paying Consumer Cyclical Stocks
- The Complete List of Dividend-Paying Technology Stocks
- The Complete List of Dividend-Paying Healthcare Stocks
- The Complete List of Dividend-Paying Energy Stocks
- The Complete List of Dividend-Paying Financial Stocks
Another form of diversification is by size. Investors should own a healthy balance of small-capitalization stocks, mid-capitalization stocks, and large capitalization stocks.
These universes of stocks are stratified into different stock market indices which are maintained by financial giants like Moody’s, Dow Jones, and Standard & Poor’s. A few large-capitalization indices are shown below:
- The Complete List of S&P 500 Stocks
- The Complete List of Dow Jones Industrial Average Stocks
- The Complete List of NASDAQ-100 Stocks
Alternatively, a few mid- and small-cap indices are listed below:
Diversification aside, there is a substantial body of evidence that proves that stocks that consistently raise their dividends over time tend to outperform the broader stock market. With this in mind, the following databases contain some of the most promising businesses in our investing universes:
- The Dividend Aristocrats: S&P 500 stocks with 25+ years of consecutive dividend increases
- The Dividend Achievers: dividend stocks with 10+ years of consecutive dividend increases
- The Dividend Kings: considered to be the best-of-the-best among dividend growth stocks, the Dividend Kings is comprised of dividend stocks with 50+ years of consecutive dividend increases.