

The Correction Arrives, But It’s Not a Bear


(As published on Feb. 3, 2018)

The Correction Arrives, But It’s Not a Bear
The Fed, having informed the market months ago, is now actively shifting from quantitative easing (QE), to quantitative tightening (QT). In plain English, they are going from buying debt securities, which increases their balance sheet, to selling them which reduces it. The announced plan was to shrink the balance sheet by $10 billion a month in October, November, and December, then accelerate the pace every quarter. By the fourth quarter of 2018, the Fed will be reducing its holdings by up to $50 billion a month (= $600 billion a year). The chart below, shows the $20 billion reduction in the Fed’s balance sheet to start off 2018.

It must be emphasized that the Fed is planning to reduce its balance sheet by $600 billion per year, at the same time as the government is looking to borrow $1.2 trillion (a result of Tax Reform). In addition, there are noises coming from China that they may not be as eager to buy US Treasuries as in the past, and both the European and Japanese Central Banks are launching quantitative tightening trial-balloons. Last time we checked, the law of supply-and-demand was still a thing; if demand goes down while supply goes up, then prices will drop (i.e. yields increase). The chart below illustrates this with the January time-period highlighted.

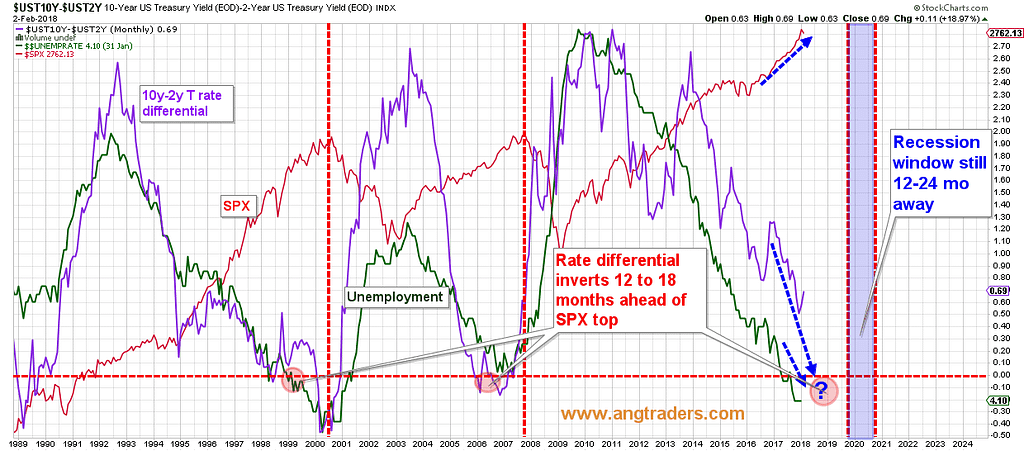
That is nothing short of a long-bond sell-off and the proximate cause of the correction in the stock market (that we have been calling for). Bonds and stocks falling together is never a pretty site, but while we see further downside to stocks, we do not see this as the start of a bear market. The market is likely to correct further, but the dip-buyers will reemerge after some appropriate carnage. Rates are climbing, but rates are still low and the 10-y minus 2-y rate differential has moved further away from the inversion point. Also, the above referenced European and Bank of Japan QT insinuations are unlikely to become reality any time soon; they will continue easing if rates rise too fast. The stock market desperately needed this cooling period, but the bull market is not over yet.
Equities
Sentiment
The AAII investor bullish sentiment remained below the 50% mark dropping slightly to 44.8%, while the bearish sentiment rose 4.7%, remaining below 30% at 28.8% (chart below).

{This section is for paid subscribers only}
The SPX has (at least for now) started to drop as the NAAIM index 50 MA continues to roll-over. This is pushing the correlation back toward normal positive readings, as it did during the 2015 double-dip correction (red arrows below). Because the market, up to this point, has refused to correct a healthy 3–5%, it may now result in a more substantial 10–15% correction (chart below).

The put:call ratio (8 MA) has remained neutral despite last week’s correction, but the ratio itself is on the rise and may signal a local-top (chart below).

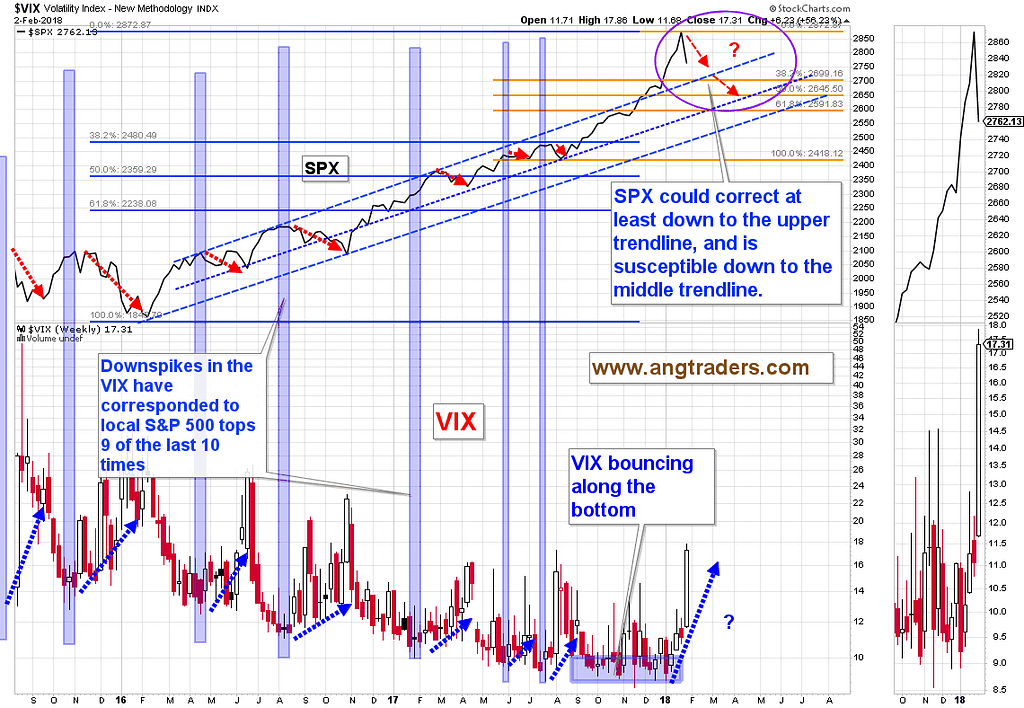
The VIX volatility index jumped above 17 for the first time since November 2016 as the SPX drops back toward the trendlines. There is potential for another 200-point drop in the SPX (chart below). We held-off writing call options against our UVXY position last week, but we may write some options this coming week if the VIX goes above 20.
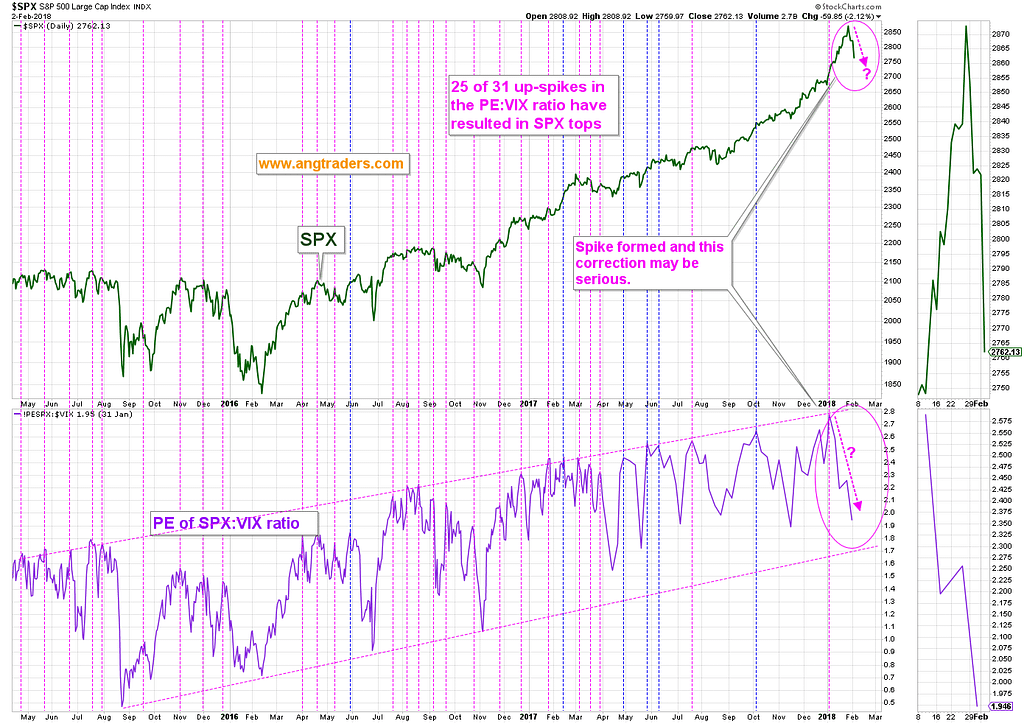
The PE of the SPX in ratio to the VIX has peaked recently which has resulted in a near-term correction in the S&P 500 80% of the time (chart below).
{This section is for paid subscribers only}
Technical
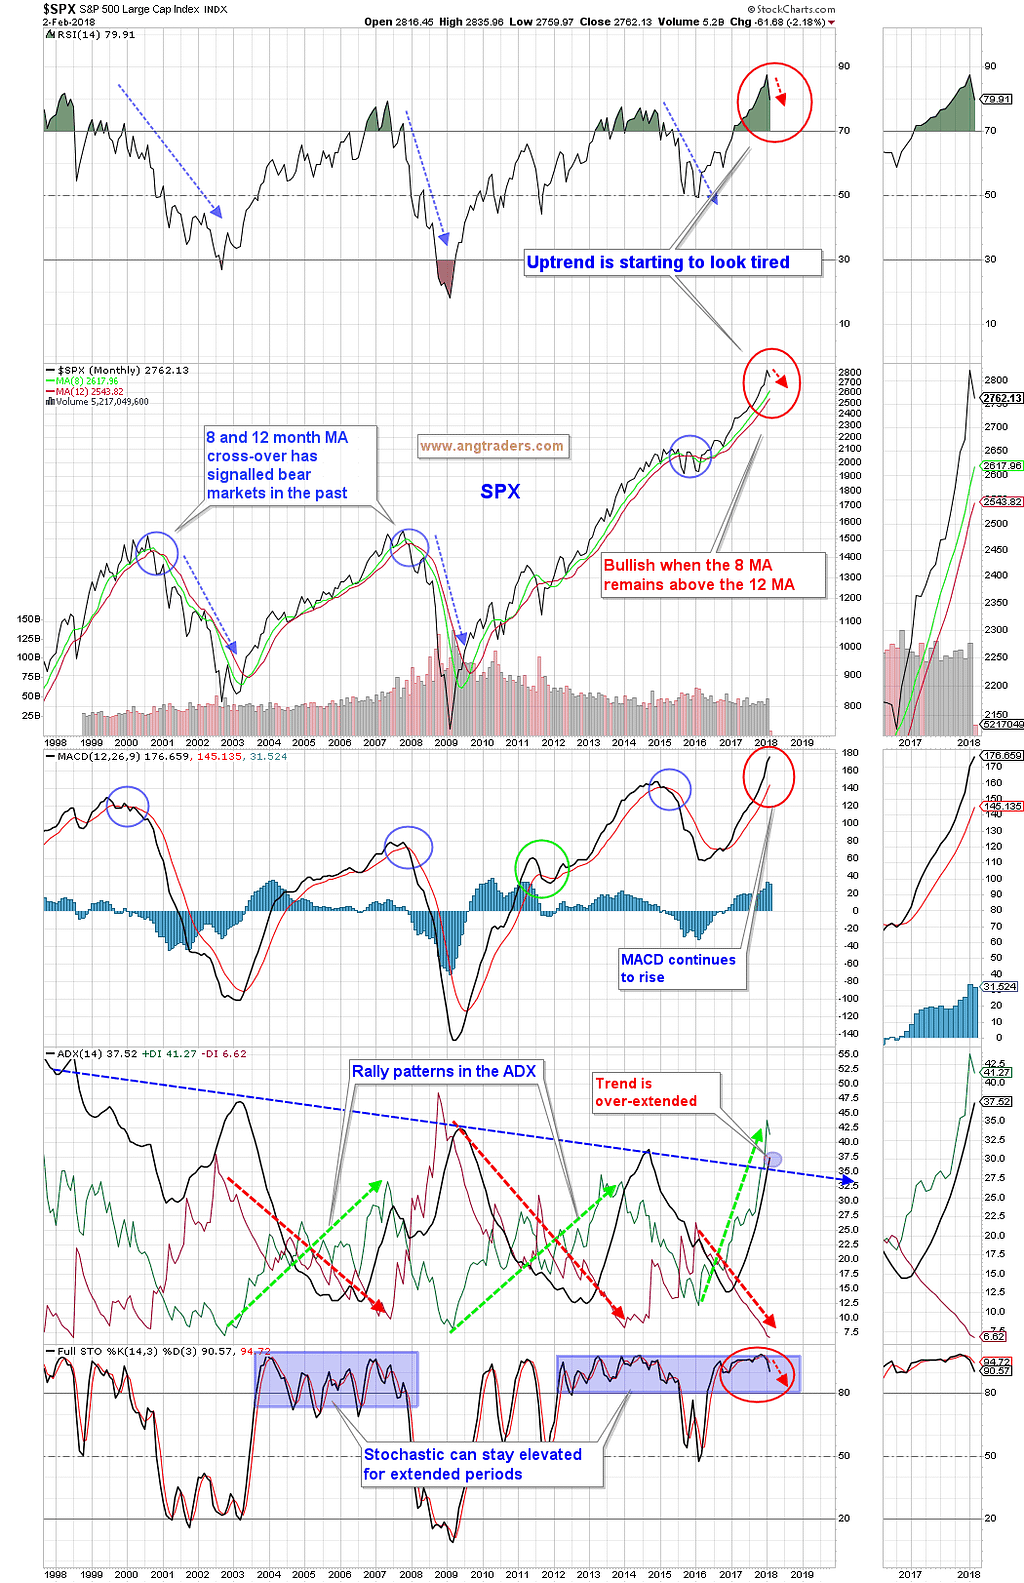
While the long-term technical averages continue to demonstrate a late-stage bull market, and no warning signs are evident, the ADX trend (black line) has moved above the down-sloping major trend (blue dashed line on chart below), and the bullish and bearish momentums (green and red lines, respectively) are both at extreme levels which could facilitate a correction similar in magnitude to 2015 (chart below).
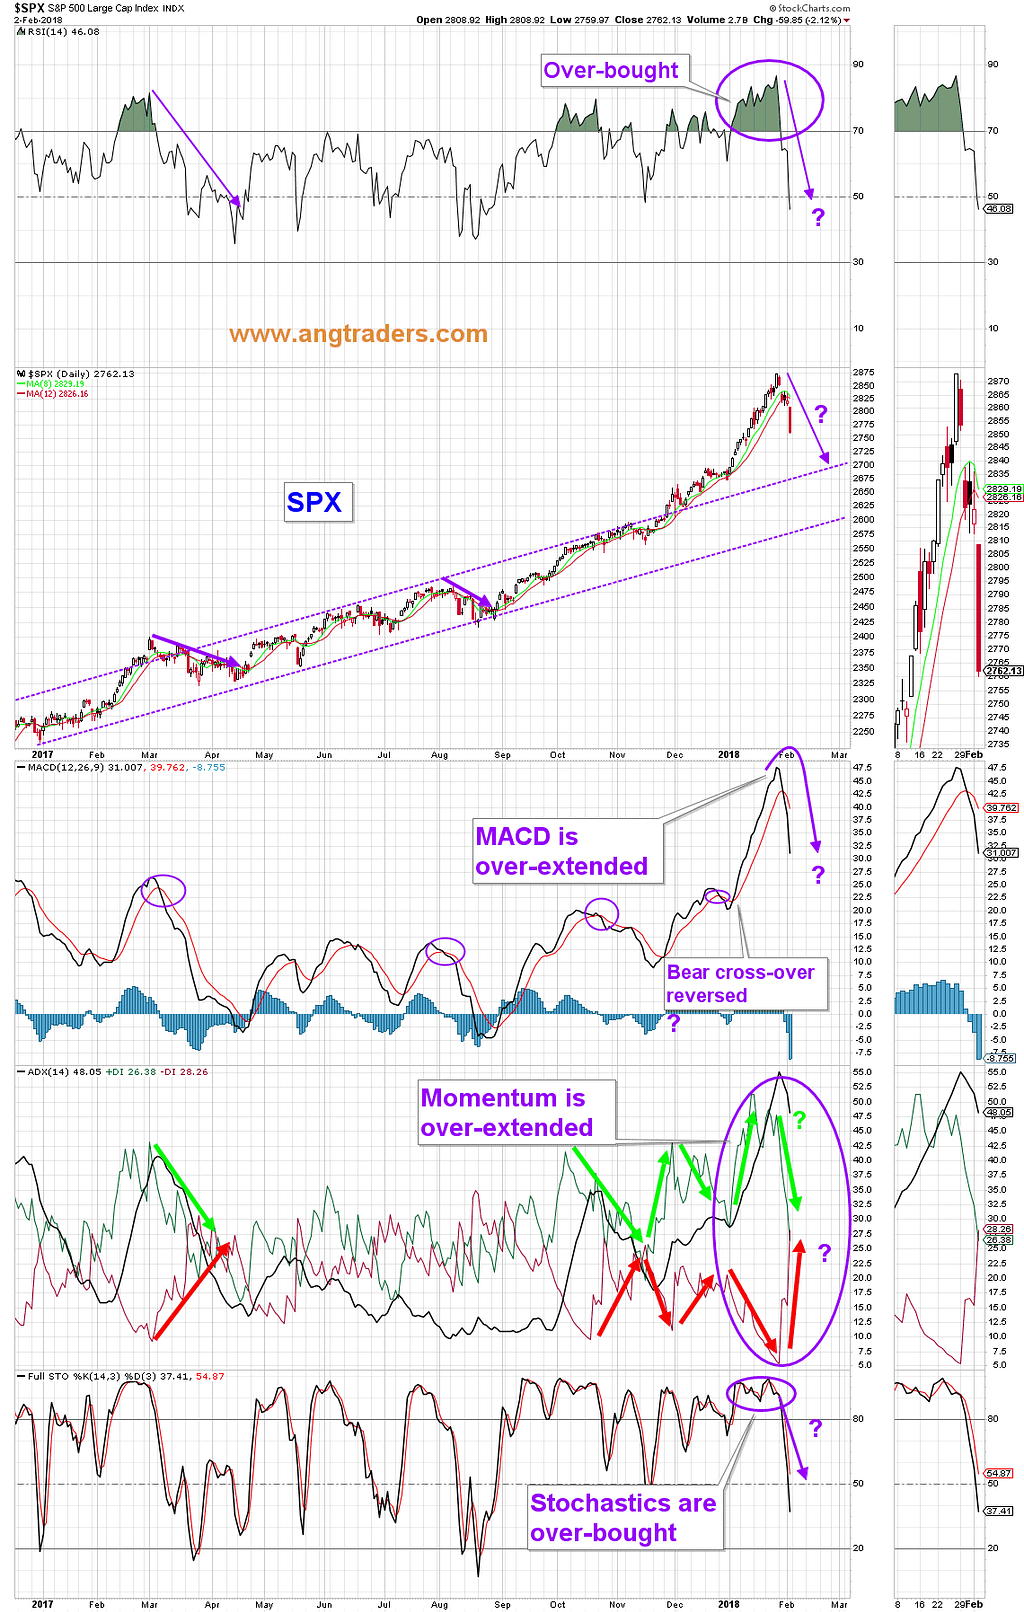
The short-term over-extended technical position has been relieved somewhat, but that may not preclude a significant follow-through to the downside this coming week. This correction has the potential of becoming a 10–15% pull-back like 2015 (chart below).
Fundamentals
The 10-y minus 2-y differential jumped this past week from 0.53 to 0.69 but continues to maintain a slope that would see an inversion in the second half of 2018. That would imply a recession could start sometime in 2019.
Oil
{This section is for paid subscribers only}
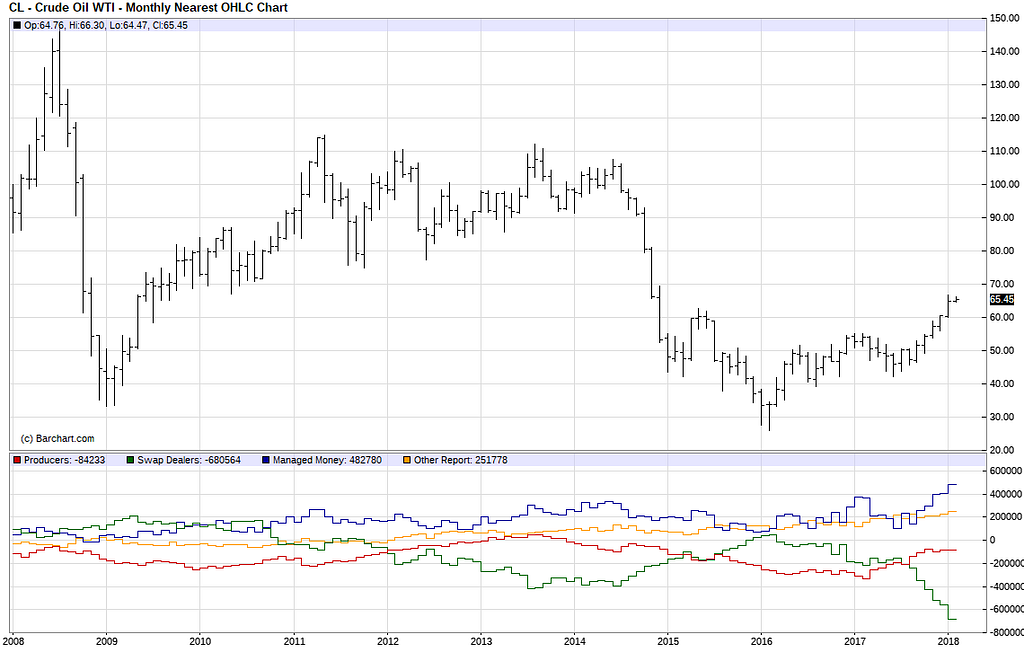
The futures traders positioning continues to be a red flag for the oil price. The commitments of oil futures traders increased further their all-time extreme levels; The swap dealers (the true experts in this market) added another 17k contracts to their net short position for an outrageous 680k contracts, while the speculators (you know, the guys with suspenders that play with other people’s money), increased their net long position by 5k contracts to 483k contracts. The managed money (other people’s money) are usually wrong at the pivot points, while the swap dealers are usually correct. The swap dealers are obviously expecting to buy back the oil at lower prices in the future (March).
Gold
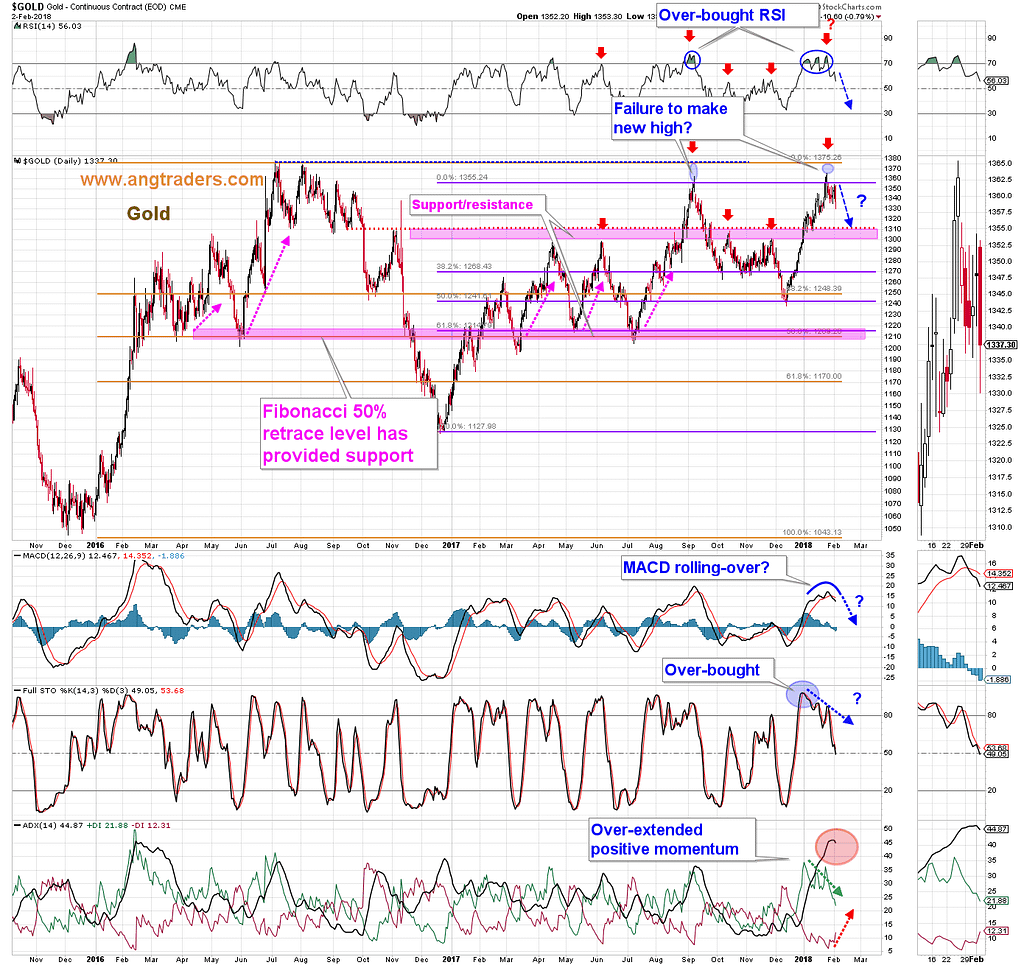
Technically, gold is coming off over-bought territory. Just like last September, gold failed to make a new high and has started to slide back. The next support is in the $1310-$1300 range with $1270 coming after that (38% retrace of the $1130 to $1355 rally).
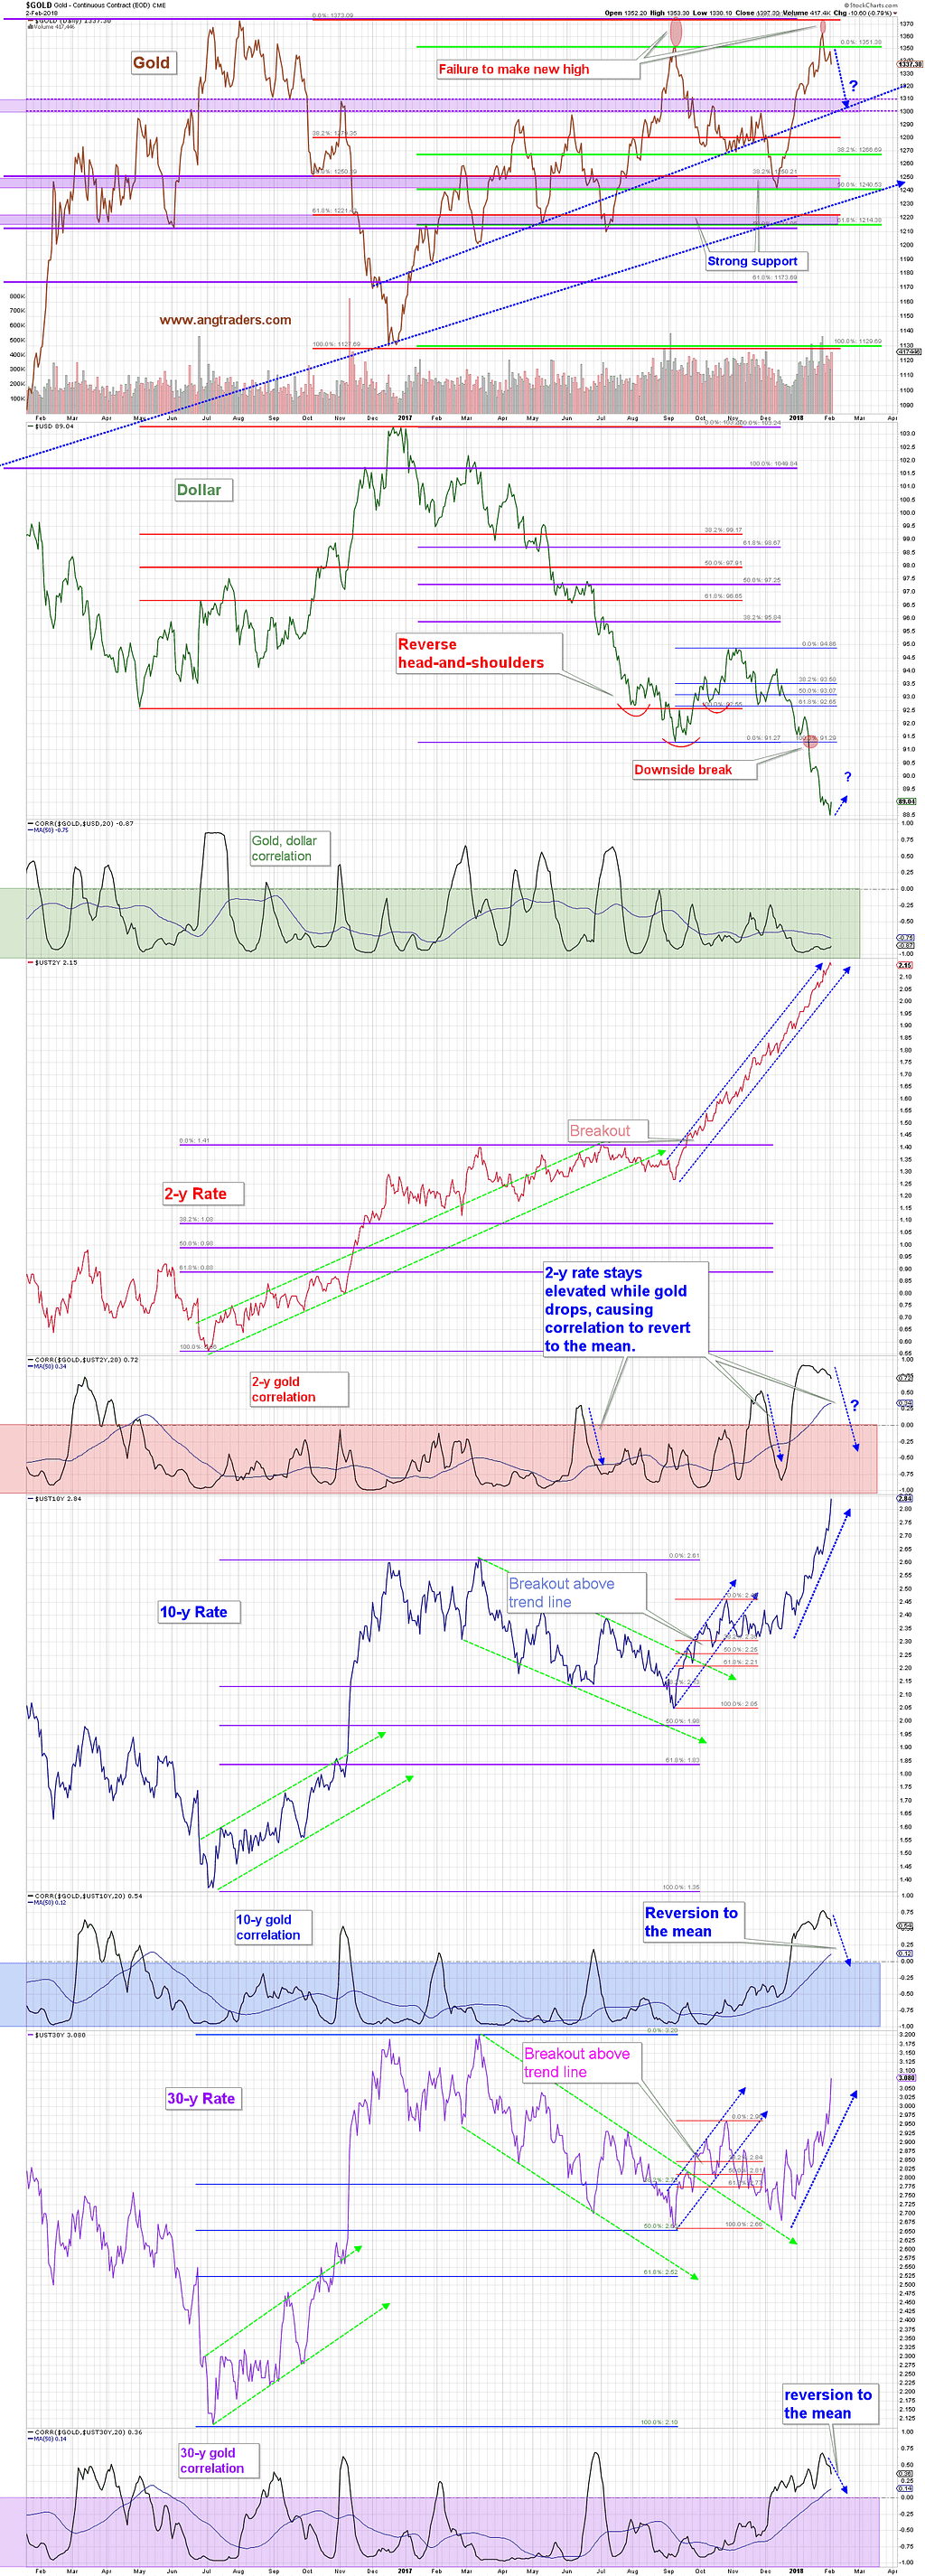
The anomalous positive correlation between gold and Treasury rates that has been in effect since December, has started to turn back down toward the more usual negative reading. If the long rates continue to rise (or even hold steady), gold should drop to test support (chart below).
{This section is for paid subscribers only}
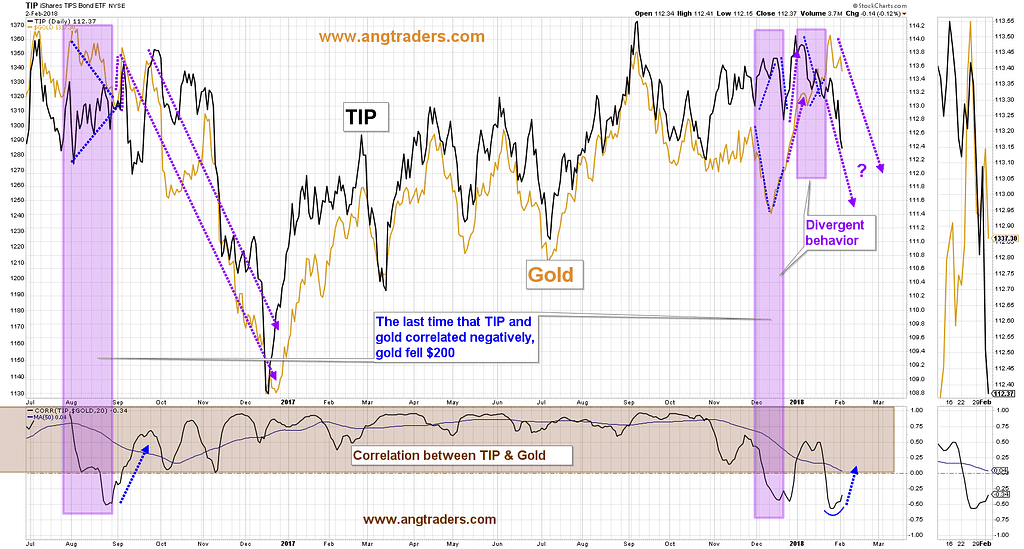
Normally, gold has a strong positive correlation with TIP (the Treasury Inflation Protected Securities etf), but until recently gold has diverged from TIP. The last time it did this was in mid-2016, shortly before it dropped $200. This past week, gold and TIP started trading down in tandem and the correlation is heading back into positive territory (chart below).
In conclusion:
- The stock market has started the long-anticipated correction.We expect at least some follow-through to develop next week.
- {This section is for paid subscribers only}
We wish our subscribers a profitable week ahead and ask that email be monitored for Trade Alerts.
Regards,
ANG Traders
Email queries to [email protected]
Join us at www.angtraders.com
Source: Nicholas Gomez