

The Fed Still Matters


The minutes from Yellen’s final meeting as Fed Chair (January 30–31), were released in the middle of this holiday-shortened trading week, and despite the market’s wild reaction on the day-of, there was nothing in the release that could be spun as either dovish or hawkish. It was just typical; further gradual policy firming would be appropriate, given the stronger outlook for economic growth.

The meeting occurred before the release of the January CPI, PPI, and employment reports, and before the two-year budget agreement, and before the 10% market correction. This diminishes the minutes usefulness in moving markets; the market would have closed unchanged for the week if it had not been for the rally in the last hour of Friday’s trading.
The market continues to expect three more hikes this year, with the first hike given an 83% chance of happening on March 21st (chart below).

As of Friday, the market is also pricing in a 65% probability of at least 3 hikes before the end of 2018 (chart below).

Despite the common belief that rising rates kill bull markets, the facts show that rates commonly rise during bull markets. It is not the raising of rates that end bull markets, it is the level that rates reach that matters. And as the chart below demonstrates, the level at which rates trigger bear markets has been steadily decreasing for the past 35-years. Three hikes this year would bring the Fed funds rate up to meet the trend-line, and more than three hikes would push it over the line and into recession/bear market territory. Until then, however, we remain confident that the market is in the midst of a (much needed) correction, not the start of a bear market.

More meaningful than the Fed’s January minutes, and perhaps long-term market moving, will be Fed Chairman Powell’s semiannual monetary policy report to congress this coming week (February 28). Powell’s testimony has the potential to either pull the market out of the correction and continue the late-stage bull, or to frighten the market and keep it back on its heels for a while longer. Either way, the market is likely to take notice.
Equities
Sentiment
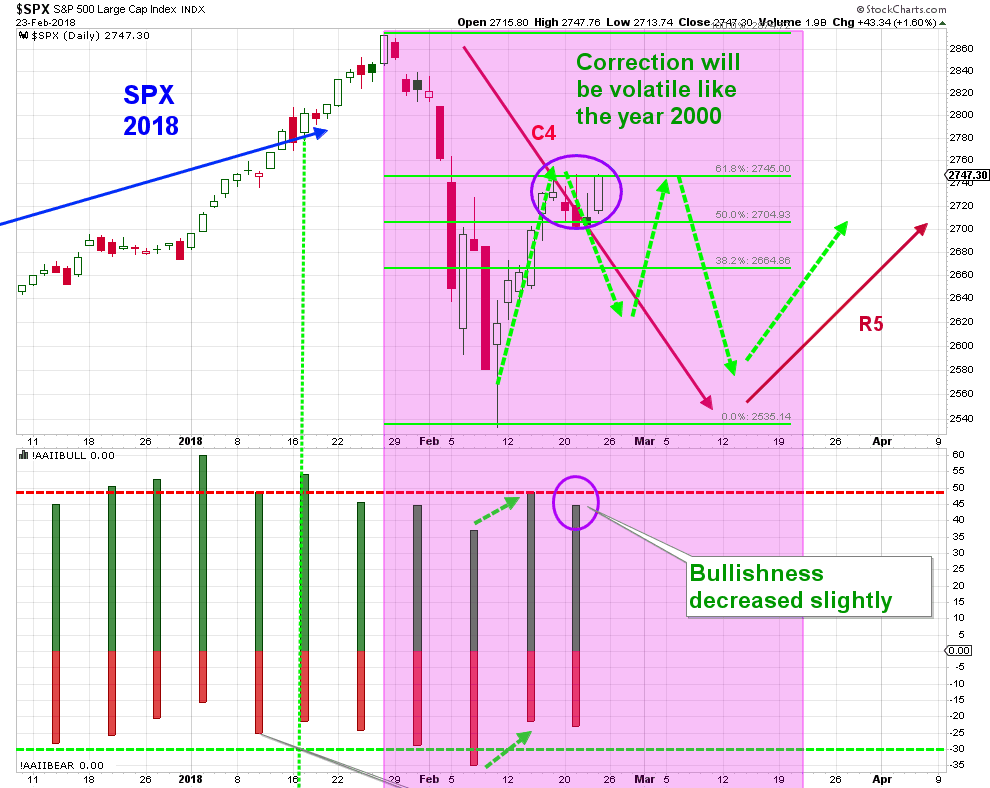
Bullish sentiment, according to the AAII survey, was slightly less bullish this week, dropping 3.9% to 44.7%. This continues to fit with the trading pattern from the 2000 correction (C4) (two charts below).

{This section is for paid subscribers only}
The 8-week moving average (MA(8)) of the put-to-call option ratio has turned down, potentially forming an up-spike which means the SPX is likely to rally. At the moment, this fits with our expectation of volatility in the market for the next while (chart below).

{This section is for paid subscribers only}
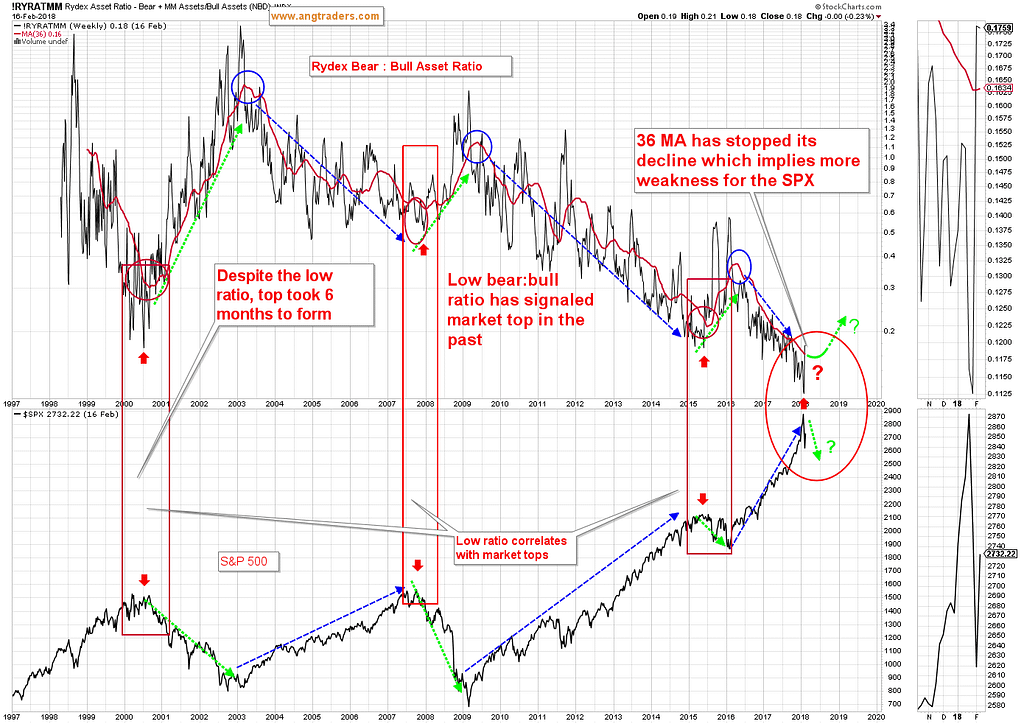
The RYDEX Funds Bear:Bull asset ratio 36 MA has stopped its bullish decline (visible only in the zoom panel of the chart), which means the SPX is likely to see further weakness (chart below).
Technical
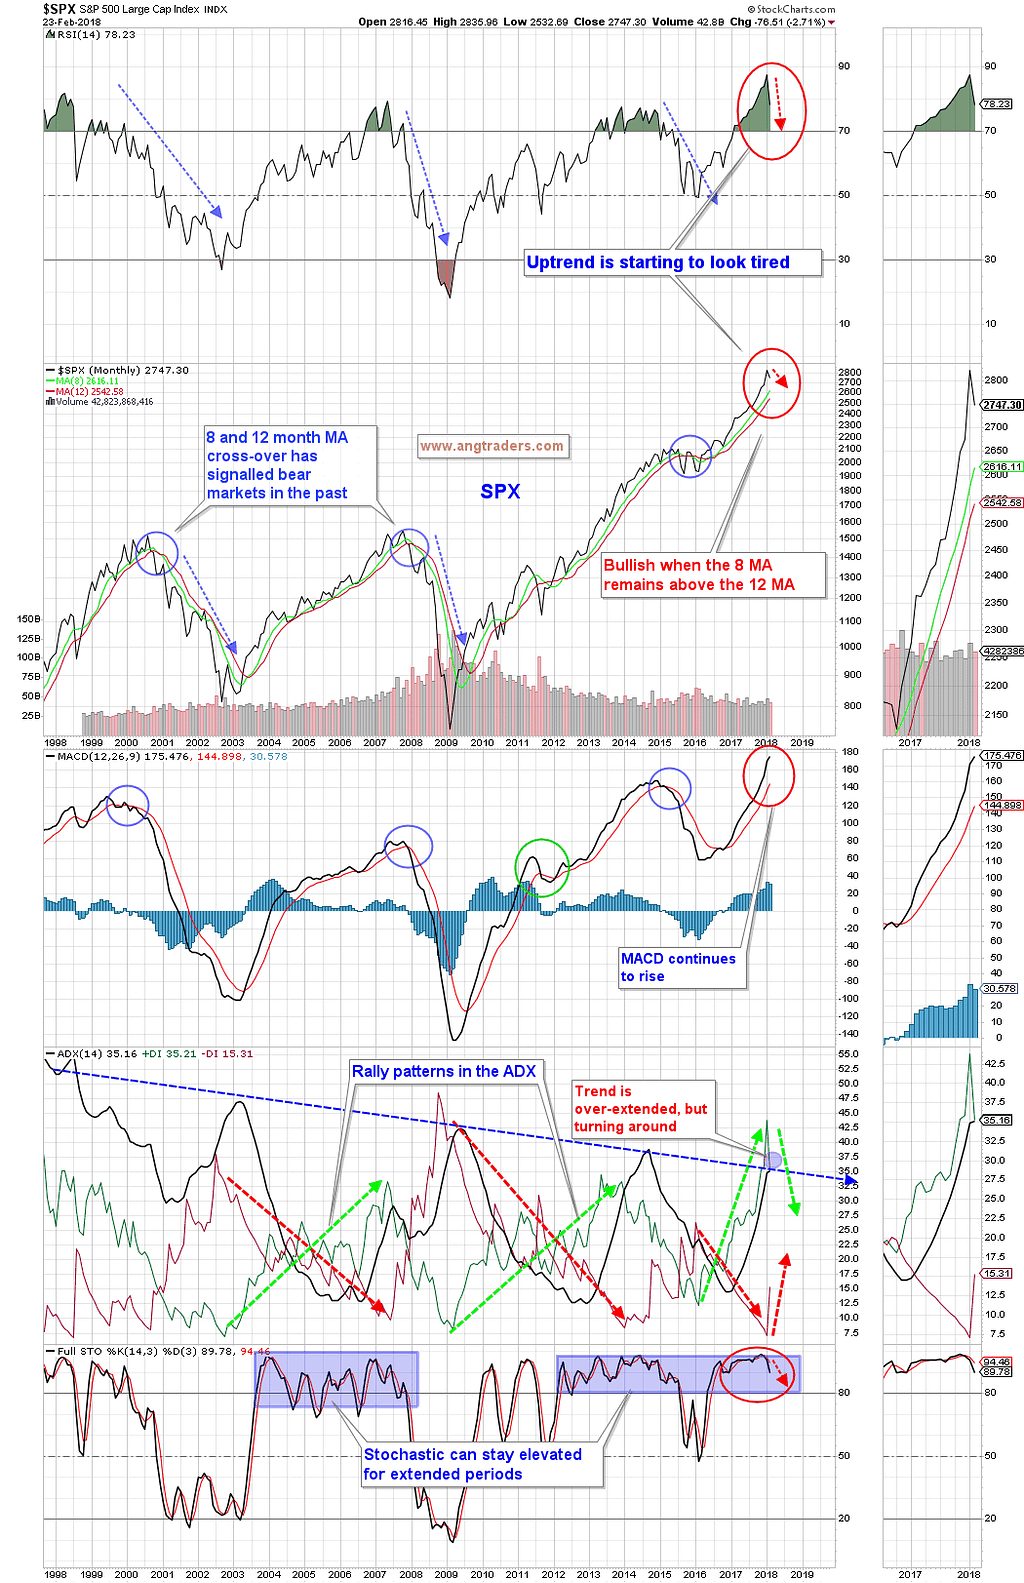
The very long-term technical averages show that the bull is ‘long-in-the-tooth’, but until the 8 MA crosses below the 12 MA, there are no warning flags, however, shorter-term weakness is likely (chart below).
{This section is for paid subscribers only}
Fundamental
{This section is for paid subscribers only}
The 10-y minus 2-y differential was slightly lower this past week, going from 0.66 to 0.63, and continues to maintain an overall slope that would see an inversion in the second half of 2018. Which would imply a recession could start sometime in 2019 (chart below).

Our Price Modelling System is neutral/positive on the daily scale; neutral/negative on the weekly scale; and positive on the monthly scale.
We continue to hold our hedged short SPX position via the long SPXS and long put option trade.
Gold
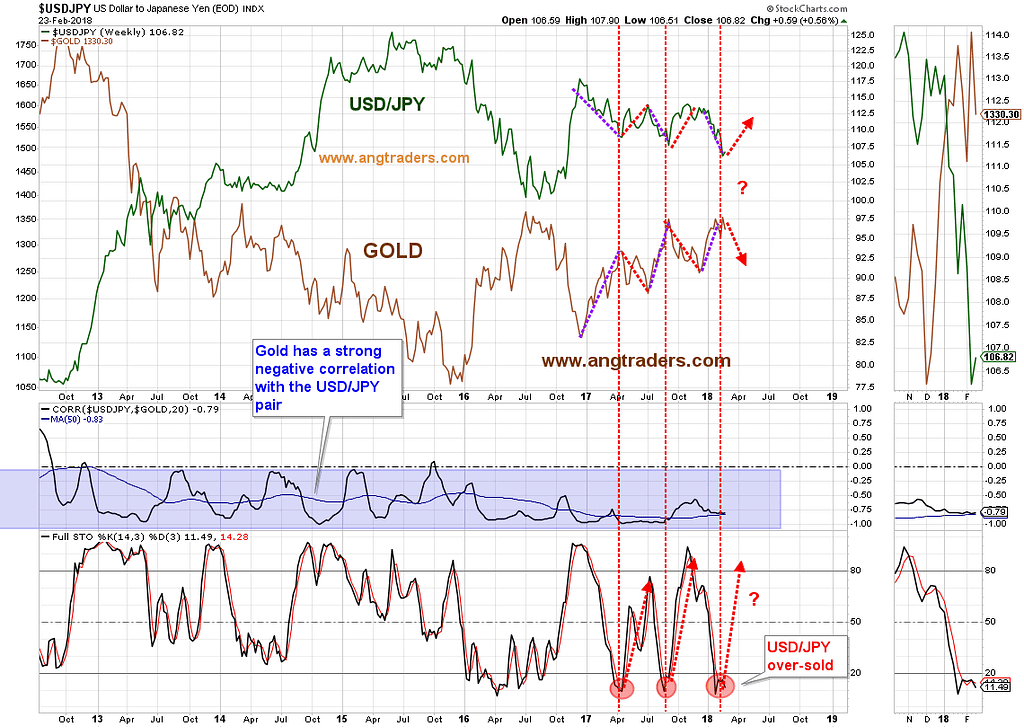
Gold normally trades in correlation with the four big markets: the dollar, the USD/JPY FOREX pair, interest rates, and TIPS (inflation expectations). Since the start of the year, however, gold has disconnected from its usual correlation with interest rates and with inflation expectations. Effectively, gold has become a currency trade by continuing to strongly correlate with the dollar and the USD/JPY pair, while the dollar has disconnected from its usual correlation to interest rates; interest rates are rising, but the dollar has been dropping.
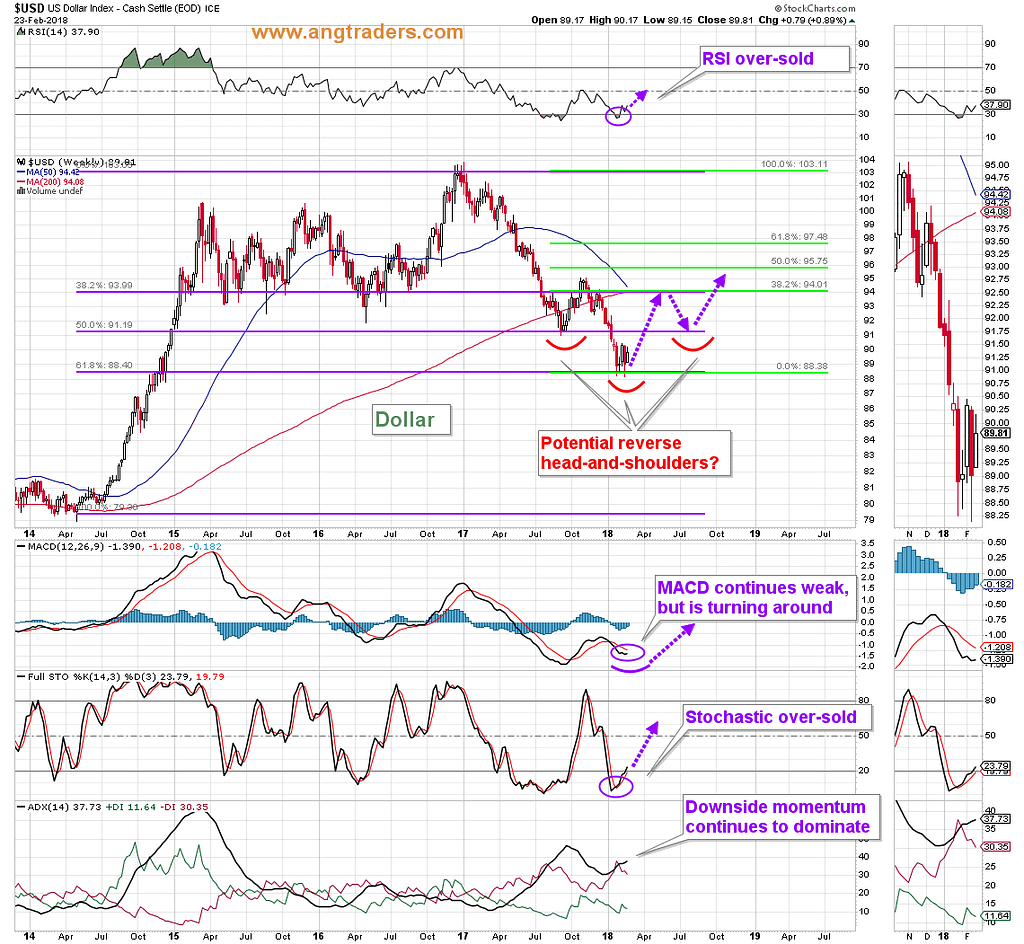
It is starting to look like the dollar may be forming a bottom as part of a bigger inverse head-and-shoulders pattern. If this in fact is the case, then gold could become weaker as the dollar strengthens (chart below).
Gold continues to maintain a strong negative correlation with the USD/JPY pair and, technically, the USD/JPY pair is over-sold (chart below) and ready for a rally, which would put pressure on gold.
{This section is for paid subscribers only}
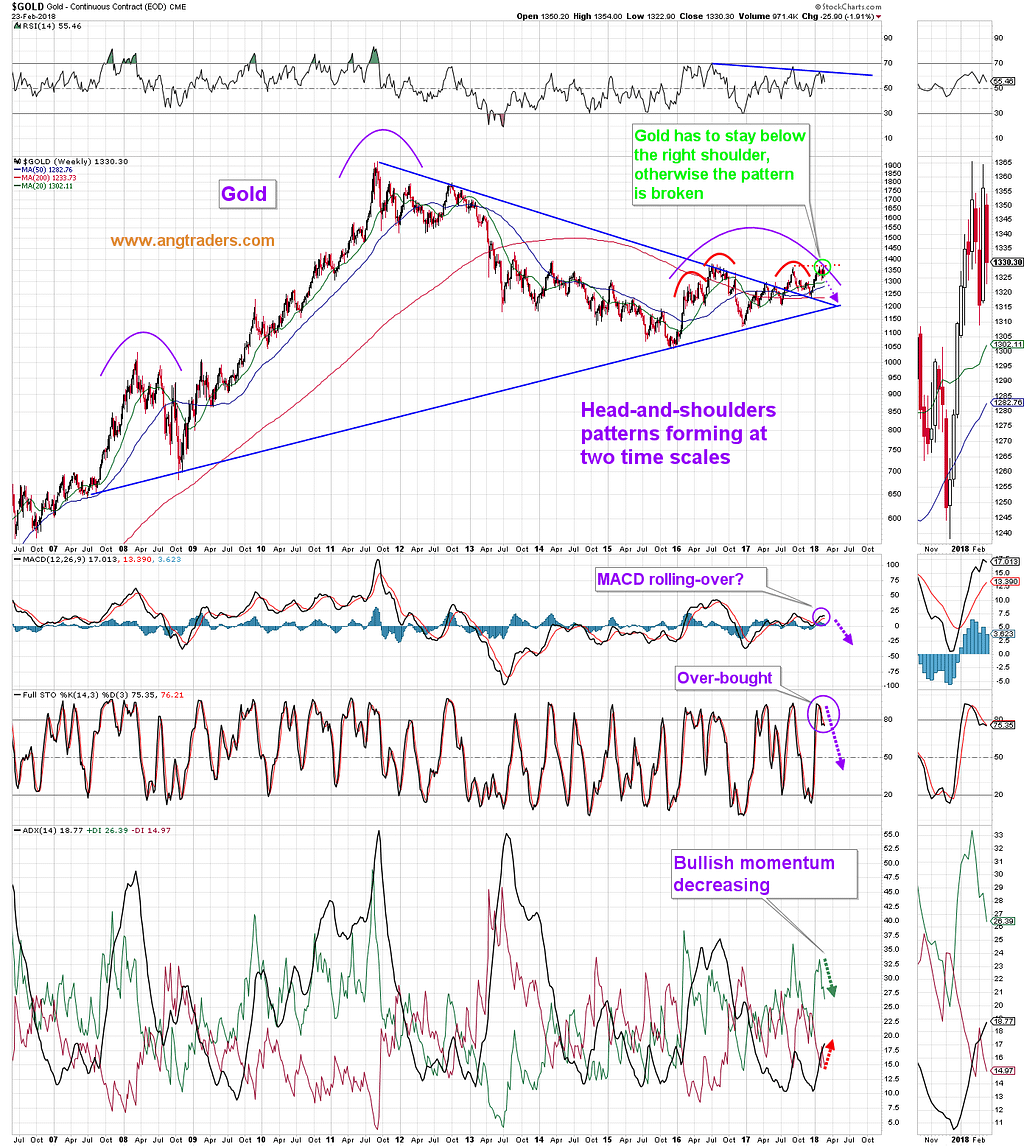
The technical weakness in gold is not just in the short term. The long-term chart below, shows that the RSI is following a declining trend-line, the MACD has started to roll-over toward a possible bear cross-over, the stochastics are coming off over-bought levels, and the bullish momentum is falling.
The fact that the gold fell this past week, meant that we did not have to hedge our short gold positions. We will continue to hold our gold shorts.
{This section is for paid subscribers only}
We wish our subscribers a profitable week ahead and ask that email be monitored for Trade Alerts.
Regards,
ANG Traders
Email queries to [email protected]
Source: Nicholas Gomez