


Updated April 12th, 2022 by Ben Reynolds
Former Libertarian presidential candidate Harry Browne is the originator of the Permanent Portfolio. He popularized the concept in his book Fail-Safe Investing.
The portfolio consists of 4 equally weighted assets:
- 25% Broad stock market (SPY)
- 25% Long-Term Government Bonds (TLT)
- 25% Gold (GLD)
- 25% Short-Term Treasuries (SHY)
Note: The Permanent Portfolio book covers the portfolio in great detail.
The Permanent Portfolio’s high percentage of gold and short term treasuries is immediately noticeable. Each item in the portfolio is meant to do well in different economic regimes. The 4 economic regimes the Permanent Portfolio considers are:
- Inflation (gold)
- Deflation (long-term government bonds)
- Recession (short-term treasuries)
- Prosperity (stocks)
The portfolio weights each economic regime equally. The portfolio is then rebalanced annually. This approach is intuitive, diversified, and simple to implement.
So how has the Permanent Portfolio done?
It has performed extremely well over the last 4+ decades. Since 1972, the portfolio has had a CAGR of 8.9% per year, with a standard deviation of only 7.8% using annual data.
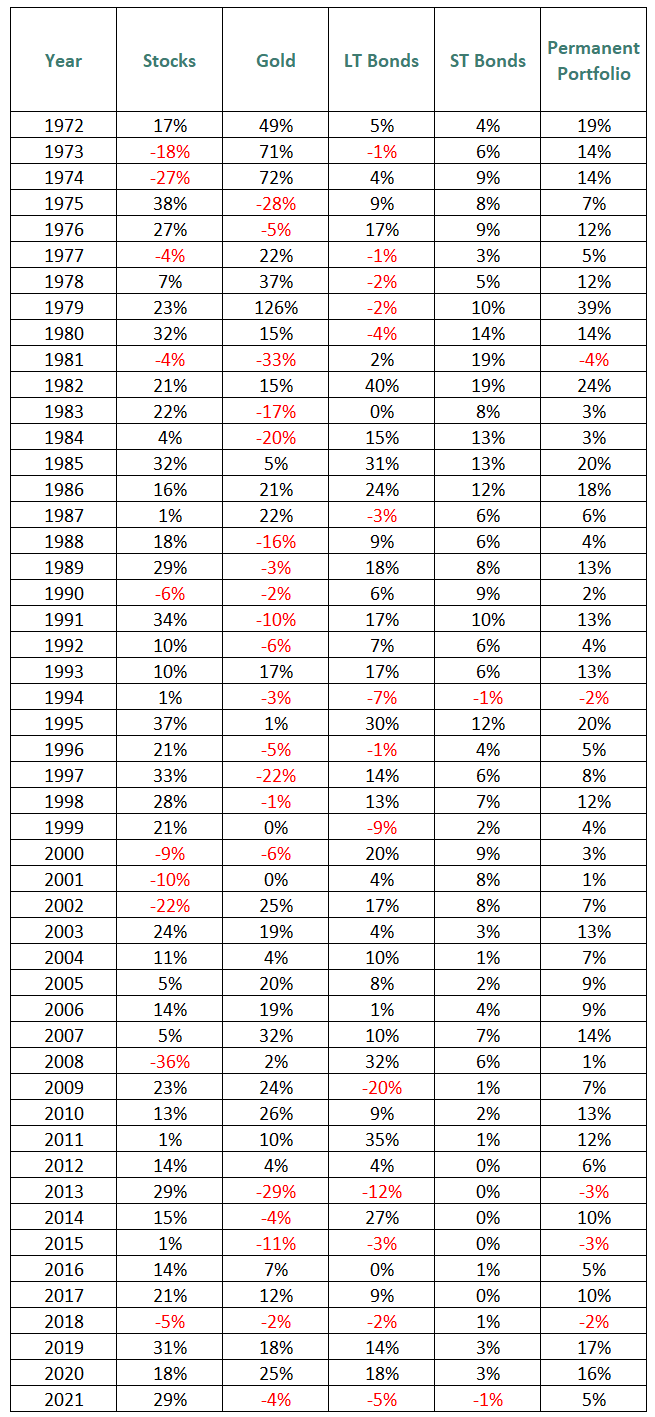
Note:
Click here to download this data as an Excel spreadsheet.Sources: Return data prior to 1994 for stocks, prior to 2005 for gold, and prior to 2003 for long-term bonds and short-term bonds is from the now defunct Crawling Road site. Return data after the ‘Crawling Road’ data set is from the following ETFs: stocks (SPY), gold (GLD), long-term government bonds (TLT), short-term government bonds (SHY). All other data through 2017 is from Yahoo Finance. Data from 2018 through 2021 is from Ycharts.
The Permanent Portfolio has generated solid returns with very low volatility because it invests in assets that have very little correlation to one another, as the correlation table below shows.
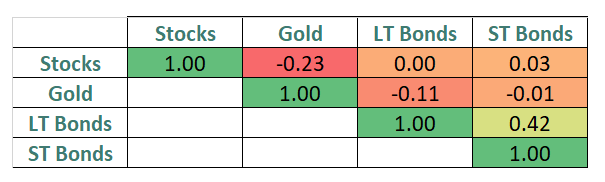
Source:
Same as previous image.Stocks, long-term bonds, and gold all have near 0 or negative correlations to one another. They are the only 3 established asset classes I’ve encountered that maintain low correlations over long periods of time. Bitcoin and other cryptocurrencies could potentially be a fourth asset class to add, depending on whether one believes it is an established asset class.
Cash & Leverage
The short-term bond portion of the Permanent Portfolio is a cash substitute. Cash/short-term treasuries shouldn’t be viewed as a separate asset class. Instead it should be viewed as leverage. Putting 25% of your portfolio into cash (like the Permanent Portfolio does) is the same thing as having a portfolio that is 75% leveraged; the opposite of borrowing money to invest.
The Permanent Portfolio is really 3 ‘risky’ (as opposed to ‘riskless’) asset classes (stocks, long-term government bonds, gold) leveraged to 0.75 instead of fully invested.
Related: Dividend Stocks vs. Bonds: Comparing Risk-Adjusted Returns
But what would happen if we invested only in the 3 risky asset classes in the Permanent Portfolio?
If you invested equally in stocks, long-term US bonds, and gold for the same period (1972 through 2021), your portfolio would have a CAGR of 9.8% with a standard deviation of 10.0% (using annual return data). This compares favorably to the original Permanent Portfolio’s CAGR of 8.9%, although the original Permanent Portfolio’s standard deviation is just 7.8%.
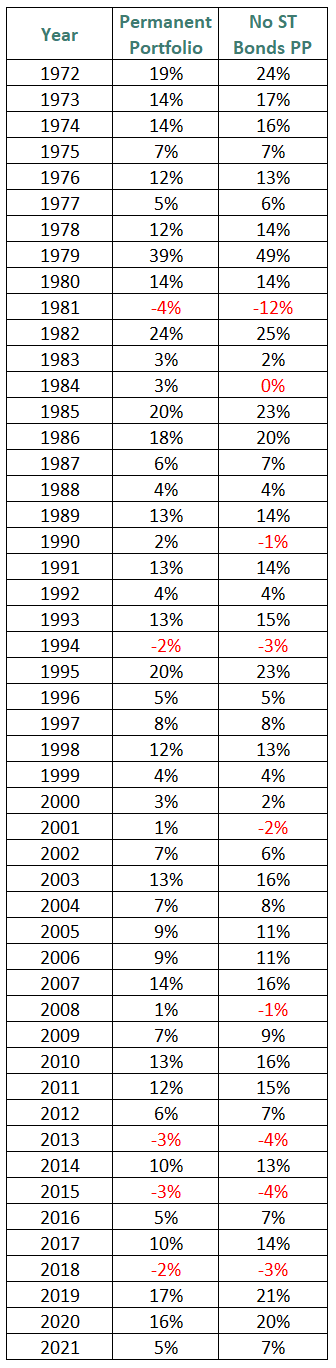
Source:
Same as previous image.While risk is increased somewhat by removing short-term bonds from the Permanent Portfolio, the portfolio’s annualized returns are increased. There are additional steps one can take to improve upon the Permanent Portfolio concept.
Dividend Aristocrats Improve Permanent Portfolio Performance
Dividend Aristocrats have historically outperformed the stock market with less volatility. They tend to do better in recessions (while still posting negative returns on an absolute basis) versus the broader market.
The Dividend Aristocrats are a group of 66 stocks with 25+ years of consecutive dividend increases in the S&P 500 that meet certain minimum size and liquidity requirements. They are high quality blue chip dividend stocks.
The Dividend Aristocrats generated a CAGR of 12.2% from 1990 through 2021, versus 10.3% for the S&P 500. Performance starts in 1990 because that’s the first year of data I’ve found for the Dividend Aristocrats.
The Dividend Aristocrats had annual price standard deviation of 13.7% versus 16.6% for the S&P 500. The image below shows performance by year for the two.
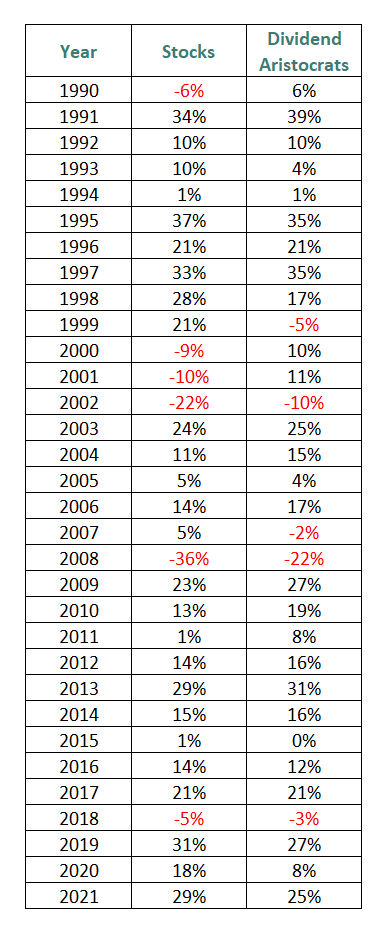
Note:
Click here to download an Excel spreadsheet of Dividend Aristocrat returns.Sources: Dividend Aristocrats data from 1990 through 2011 from Ploutus. Dividend Aristocrats data from 2012 and 2013 is from S&P. Dividend Aristocrats data from 2014 through 2021 is from Ycharts for the Dividend Aristocrats ETF (NOBL). S&P 500 data is from same sources as listed previously.
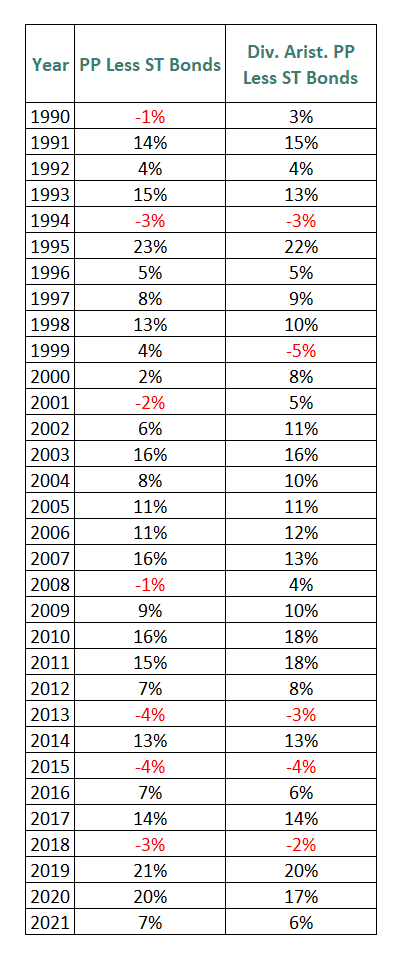
As one would expect, replacing the stock market portion of the unlevered (no short-term bonds/cash) Permanent Portfolio with Dividend Aristocrats significantly improves both portfolio return and volatility.
From 1990 through 2021 replacing the S&P 500 (‘stocks’) component with the Dividend Aristocrats increased CAGR from 7.7% to 8.5%, and reduced annual standard deviation from 7.1% to 6.8%.
Sources:
Same as previous.Final Thoughts
The Permanent Portfolio works by spreading risk across uncorrelated asset classes and harvesting gains by rebalancing annually. The portfolio has historically done very well on a risk adjusted basis, despite its simplicity.
Replacing the total stock market section of the permanent portfolio with Dividend Aristocrats has historically significantly improved the portfolio.
The Permanent Portfolio is an excellent option for risk averse investors and retired investors who need to make solid returns on their investments while avoiding large drawdowns.