


Updated on July 16th, 2019 by Bob Ciura
In poker, the blue chips have the highest value. We don’t like the idea of using poker analogies for investing. Investing should be far removed from gambling.
With that said, the term “blue chip” has stuck for a select group of stocks….
So what are blue chip stocks?
Blue chip stocks are established, safe, dividend payers. They are often market leaders and tend to have a long history of paying rising dividends. Blue chip stocks tend to remain profitable even during recessions.
At Sure Dividend, we define Blue Chip stocks as companies that are members of 1 or more of the following 3 lists:
- Dividend Achievers (10+ years of rising dividends)
- Dividend Aristocrats (25+ years of rising dividends)
- Dividend Kings (50+ years of rising dividends)
You can download the complete list of all 271 blue chip stocks below:
Click here to download your Excel spreadsheet of all 271 blue chip stocks, including metrics that matter like dividend yield and the price-to-earnings ratio.
You can view a preview of our blue chip stocks spreadsheet below:
| VZ | Verizon Communications, Inc. | 55.64 | 4.3 | 229,531.9 | 14.4 | 62.0 |
| T | AT&T, Inc. | 33.00 | 6.3 | 234,484.7 | 12.3 | 77.2 |
| TDS | Telephone & Data Systems, Inc. | 32.45 | 2.0 | 3,610.1 | 23.8 | 48.5 |
| JW/A | 0.00 | 0.0 | 0.0 | |||
| MDP | Meredith Corp. | 54.93 | 4.2 | 2,383.1 | -914.0 | -3,828.4 |
| MCD | McDonald's Corp. | 213.37 | 2.0 | 164,164.5 | 28.0 | 56.5 |
| NKE | NIKE, Inc. | 86.55 | 1.0 | 135,120.8 | 33.8 | 33.8 |
| LOW | Lowe's Cos., Inc. | 102.71 | 1.9 | 80,288.0 | 35.1 | 65.7 |
| TJX | The TJX Cos., Inc. | 54.83 | 1.5 | 65,726.7 | 22.1 | 33.2 |
| TGT | Target Corp. | 88.51 | 2.9 | 44,685.8 | 15.4 | 45.1 |
| ROST | Ross Stores, Inc. | 106.05 | 0.9 | 38,635.9 | 24.4 | 21.5 |
| VFC | VF Corp. | 86.65 | 2.2 | 34,489.2 | 27.2 | 60.8 |
| BBY | Best Buy Co., Inc. | 76.94 | 2.4 | 20,215.2 | 13.7 | 33.5 |
| GPC | Genuine Parts Co. | 97.08 | 3.1 | 13,994.3 | 17.9 | 55.5 |
| HAS | Hasbro, Inc. | 121.41 | 2.4 | 13,656.4 | 42.8 | 101.4 |
| TIF | Tiffany & Co. | 92.88 | 2.4 | 11,136.7 | 19.9 | 47.8 |
| COLM | Columbia Sportswear Co. | 105.15 | 0.9 | 6,978.3 | 24.4 | 22.0 |
| PII | Polaris Industries Inc. | 94.15 | 2.9 | 5,046.3 | 17.8 | 52.0 |
| LEG | Leggett & Platt, Inc. | 39.37 | 3.8 | 5,189.1 | 18.2 | 70.2 |
| WSM | Williams-Sonoma, Inc. | 68.98 | 2.6 | 5,423.6 | 16.2 | 41.5 |
| CBRL | Cracker Barrel Old Country Store, Inc. | 169.60 | 3.0 | 4,063.7 | 18.5 | 54.9 |
| AAN | Aaron's, Inc. | 63.43 | 0.2 | 4,265.7 | 21.6 | 4.5 |
| MNRO | Monro, Inc. | 80.09 | 1.0 | 2,608.9 | 33.2 | 33.8 |
| ISCA | International Speedway Corp. | 45.45 | 1.0 | 1,961.0 | 26.2 | 27.3 |
| WMT | Walmart, Inc. | 112.36 | 1.9 | 322,069.5 | 38.7 | 71.7 |
| PG | Procter & Gamble Co. | 112.96 | 2.5 | 289,210.4 | 26.2 | 65.2 |
| KO | The Coca-Cola Co. | 54.35 | 3.1 | 218,510.2 | 34.6 | 105.9 |
| PEP | PepsiCo, Inc. | 129.91 | 2.9 | 182,153.6 | 14.3 | 41.0 |
| COST | Costco Wholesale Corp. | 279.52 | 0.8 | 123,215.7 | 34.0 | 28.7 |
| MO | Altria Group, Inc. | 50.01 | 6.2 | 92,928.6 | 15.2 | 94.9 |
| WBA | Walgreens Boots Alliance, Inc. | 54.56 | 3.3 | 48,715.5 | 10.7 | 34.8 |
| CL | Colgate-Palmolive Co. | 71.74 | 2.3 | 62,113.6 | 26.8 | 62.2 |
| KMB | Kimberly-Clark Corp. | 134.80 | 3.0 | 46,157.9 | 26.4 | 79.2 |
| SYY | Sysco Corp. | 70.17 | 2.1 | 36,106.7 | 22.9 | 48.8 |
| GIS | General Mills, Inc. | 52.54 | 3.7 | 31,578.8 | 18.0 | 67.3 |
| ADM | Archer-Daniels-Midland Co. | 40.26 | 3.4 | 22,619.5 | 13.8 | 46.2 |
| KR | The Kroger Co. | 21.14 | 0.0 | 16,662.9 | 9.2 | 0.0 |
| HRL | Hormel Foods Corp. | 40.73 | 1.9 | 22,079.8 | 21.8 | 41.9 |
| K | Kellogg Co. | 58.06 | 3.9 | 19,251.7 | 17.1 | 67.0 |
| CLX | The Clorox Co. | 164.73 | 2.4 | 20,581.4 | 26.6 | 63.2 |
| MKC | McCormick & Co., Inc. | 156.98 | 1.4 | 21,053.1 | 30.2 | 41.5 |
| CHD | Church & Dwight Co., Inc. | 74.35 | 1.2 | 18,555.1 | 31.1 | 36.3 |
| BF/B | 140779 | 0.00 | 0.0 | 0.0 | ||
| SJM | The J. M. Smucker Co. | 112.62 | 3.0 | 12,786.1 | 24.9 | 75.6 |
| BG | Bunge Ltd. | 56.42 | 3.5 | 7,970.4 | 25.9 | 92.1 |
| CASY | Casey's General Stores, Inc. | 162.75 | 0.7 | 5,984.1 | 29.3 | 20.9 |
| LANC | Lancaster Colony Corp. | 152.04 | 1.7 | 4,167.3 | 27.9 | 46.0 |
| FLO | Flowers Foods, Inc. | 23.58 | 3.1 | 4,954.5 | 28.8 | 88.6 |
| NUS | Nu Skin Enterprises, Inc. | 39.86 | 3.7 | 2,218.4 | 17.1 | 62.7 |
| JJSF | J&J Snack Foods Corp. | 161.70 | 1.2 | 3,077.7 | 34.7 | 40.3 |
| VGR | Vector Group Ltd. | 9.69 | 16.3 | 1,351.8 | 23.6 | 385.0 |
| UVV | Universal Corp. | 60.07 | 5.0 | 1,500.3 | 14.5 | 72.4 |
| TR | Tootsie Roll Industries, Inc. | 36.52 | 0.9 | 2,450.2 | 41.8 | 39.2 |
| ANDE | The Andersons, Inc. | 26.26 | 2.6 | 844.7 | 24.1 | 62.2 |
| XOM | Exxon Mobil Corp. | 75.83 | 4.4 | 317,627.9 | 17.5 | 76.3 |
| CVX | Chevron Corp. | 126.78 | 3.6 | 238,704.3 | 17.4 | 63.1 |
| EPD | Enterprise Products Partners LP | 30.38 | 5.6 | 67,145.0 | 14.7 | 82.6 |
| OXY | Occidental Petroleum Corp. | 52.19 | 5.9 | 39,295.8 | 9.8 | 58.1 |
| ET | Energy Transfer LP | 14.96 | 8.1 | 39,478.4 | 12.2 | 98.5 |
| OKE | ONEOK, Inc. | 68.42 | 4.8 | 28,537.9 | 23.0 | 111.1 |
| MMP | Magellan Midstream Partners LP | 66.78 | 5.9 | 15,003.8 | 11.5 | 67.5 |
| HP | Helmerich & Payne, Inc. | 50.81 | 5.6 | 5,620.5 | 77.3 | 431.6 |
| BPL | Buckeye Partners LP | 41.47 | 9.7 | 6,372.3 | -68.0 | -661.4 |
| HEP | Holly Energy Partners LP | 30.55 | 8.8 | 3,181.6 | 17.5 | 153.7 |
| TCP | TC Pipelines LP | 40.76 | 6.4 | 2,956.8 | -15.0 | -96.4 |
| TLP | TransMontaigne Partners L.P. | 40.99 | 7.6 | 665.2 | 24.3 | 183.8 |
| NC | NACCO Industries, Inc. | 52.13 | 1.3 | 363.2 | 8.7 | 11.0 |
| CB | Chubb Ltd. | 148.39 | 2.0 | 67,668.8 | 17.5 | 34.6 |
| SPGI | S&P Global, Inc. | 241.86 | 0.9 | 59,418.7 | 32.2 | 27.6 |
| AFL | Aflac, Inc. | 54.31 | 1.9 | 41,045.5 | 13.2 | 25.3 |
| TRV | The Travelers Cos., Inc. | 147.79 | 2.1 | 39,210.2 | 14.9 | 30.6 |
| TROW | T. Rowe Price Group, Inc. | 112.44 | 2.6 | 25,745.0 | 14.6 | 38.4 |
| AMP | Ameriprise Financial, Inc. | 149.63 | 2.4 | 19,795.0 | 11.3 | 27.4 |
| BEN | Franklin Resources, Inc. | 34.87 | 2.8 | 17,678.3 | 11.7 | 33.0 |
| CINF | Cincinnati Financial Corp. | 106.13 | 2.0 | 17,361.7 | 17.1 | 34.5 |
| WRB | W.R. Berkley Corp. | 68.92 | 0.6 | 12,181.1 | 20.0 | 12.0 |
| TMK | Torchmark Corp. | 90.77 | 0.7 | 10,015.6 | 14.2 | 10.2 |
| AFG | American Financial Group, Inc. | 103.51 | 1.5 | 9,250.3 | 12.9 | 18.8 |
| FDS | FactSet Research Systems, Inc. | 275.03 | 0.9 | 10,741.9 | 31.8 | 29.9 |
| BRO | Brown & Brown, Inc. | 35.74 | 0.9 | 9,772.8 | 25.7 | 23.4 |
| IVZ | Invesco Ltd. | 19.91 | 6.1 | 9,423.4 | 10.2 | 62.7 |
| SEIC | SEI Investments Co. | 57.85 | 1.1 | 8,617.4 | 18.8 | 20.9 |
| CBSH | Commerce Bancshares, Inc. (Missouri) | 59.15 | 1.7 | 6,418.7 | 15.7 | 26.1 |
| ERIE | Erie Indemnity Co. | 263.86 | 1.3 | 12,206.1 | 41.3 | 54.3 |
| ORI | Old Republic International Corp. | 23.16 | 3.4 | 6,958.8 | 8.9 | 30.4 |
| CFR | Cullen/Frost Bankers, Inc. | 92.89 | 2.9 | 5,795.7 | 13.0 | 38.0 |
| PBCT | People's United Financial, Inc. | 16.39 | 4.3 | 6,472.3 | 12.5 | 54.1 |
| RNR | RenaissanceRe Holdings Ltd. | 182.58 | 0.7 | 7,860.7 | 18.3 | 13.7 |
| BOKF | BOK Financial Corp. | 81.06 | 2.5 | 5,490.9 | 12.3 | 31.3 |
| PB | Prosperity Bancshares, Inc. | 67.45 | 2.3 | 4,677.3 | 14.3 | 32.7 |
| THG | The Hanover Insurance Group, Inc. | 129.36 | 1.8 | 5,219.1 | 17.3 | 30.7 |
| EV | Eaton Vance Corp. | 45.11 | 3.1 | 5,067.4 | 12.8 | 39.4 |
| AXS | AXIS Capital Holdings Ltd. | 60.85 | 2.6 | 5,026.9 | 141.8 | 374.1 |
| LAZ | Lazard Ltd. | 36.57 | 4.8 | 4,709.2 | 9.2 | 44.8 |
| OZK | Bank OZK | 30.61 | 3.0 | 3,741.0 | 9.6 | 28.4 |
| UBSI | United Bankshares, Inc. (West Virginia) | 37.05 | 3.7 | 3,716.3 | 14.9 | 55.6 |
| UMBF | UMB Financial Corp. | 65.71 | 1.8 | 3,161.4 | 16.4 | 30.1 |
| EVR | Evercore, Inc. | 88.79 | 2.3 | 3,572.7 | 10.3 | 23.7 |
| CBU | Community Bank System, Inc. | 64.55 | 2.4 | 3,324.3 | 19.5 | 46.0 |
| RLI | RLI Corp. | 88.75 | 1.0 | 3,951.1 | ||
| MCY | Mercury General Corp. | 62.23 | 4.0 | 3,466.2 | 19.9 | 79.6 |
| AEL | American Equity Investment Life Holding Co. | 26.06 | 0.0 | 2,362.9 | 8.2 | 0.0 |
| BANF | BancFirst Corp. (Oklahoma) | 57.02 | 2.1 | 1,846.1 | 14.2 | 30.1 |
| WABC | Westamerica Bancorporation | 62.55 | 2.6 | 1,664.1 | 22.3 | 58.1 |
| SBSI | Southside Bancshares, Inc. | 32.27 | 3.8 | 1,076.3 | 14.6 | 54.8 |
| TMP | Tompkins Financial Corp. | 77.66 | 2.5 | 1,207.0 | 14.7 | 37.0 |
| SRCE | 1st Source Corp. | 45.24 | 2.3 | 1,136.8 | 13.5 | 31.5 |
| CTBI | Community Trust Bancorp, Inc. (Kentucky) | 41.03 | 3.5 | 729.0 | 11.2 | 39.2 |
| BMRC | Bank of Marin Bancorp | 43.23 | 1.7 | 583.2 | 17.5 | 29.3 |
| WHG | Westwood Holdings Group, Inc. | 32.34 | 8.7 | 289.0 | 14.2 | 123.1 |
| JNJ | Johnson & Johnson | 129.35 | 2.8 | 341,546.9 | ||
| ABT | Abbott Laboratories | 87.72 | 1.4 | 155,371.3 | ||
| MDT | Medtronic Plc | 101.37 | 2.0 | 135,779.0 | 29.5 | 58.2 |
| CVS | CVS Health Corp. | 55.50 | 3.6 | 72,073.5 | -126.1 | -454.7 |
| BDX | Becton, Dickinson & Co. | 253.60 | 1.2 | 68,110.0 | 73.3 | 88.2 |
| SYK | Stryker Corp. | 209.98 | 0.9 | 77,788.7 | 22.3 | 21.2 |
| MCK | McKesson Corp. | 138.56 | 1.1 | 25,861.7 | 1,539.6 | 1,675.4 |
| ABC | AmerisourceBergen Corp. | 86.34 | 1.8 | 17,875.6 | 19.9 | 36.6 |
| CAH | Cardinal Health, Inc. | 44.30 | 4.3 | 13,272.6 | 388.6 | 1,662.6 |
| WST | West Pharmaceutical Services, Inc. | 120.62 | 0.5 | 9,039.3 | 40.8 | 19.6 |
| PRGO | Perrigo Co. Plc | 55.15 | 1.5 | 7,109.6 | 65.8 | 95.7 |
| ENSG | The Ensign Group, Inc. | 59.26 | 0.3 | 3,084.8 | 32.2 | 10.2 |
| ATRI | Atrion Corp. | 764.13 | 0.7 | 1,428.4 | 40.2 | 27.4 |
| NHC | National HealthCare Corp. | 83.47 | 2.4 | 1,297.3 | 15.3 | 36.1 |
| UNP | Union Pacific Corp. | 174.00 | 1.9 | 122,292.3 | 20.6 | 39.8 |
| MMM | 3M Co. | 177.70 | 3.2 | 100,667.2 | 18.4 | 58.3 |
| UTX | United Technologies Corp. | 135.08 | 2.2 | 114,723.4 | 20.6 | 44.4 |
| LMT | Lockheed Martin Corp. | 365.02 | 2.3 | 101,140.6 | 18.5 | 43.5 |
| CAT | Caterpillar, Inc. | 132.42 | 2.5 | 77,340.5 | 12.2 | 30.3 |
| CSX | CSX Corp. | 69.73 | 1.3 | 56,606.6 | 16.7 | 21.6 |
| GD | General Dynamics Corp. | 187.84 | 2.1 | 53,331.5 | 16.7 | 34.5 |
| RTN | Raytheon Co. | 183.16 | 2.0 | 50,293.4 | 17.1 | 33.5 |
| FDX | FedEx Corp. | 176.94 | 1.5 | 44,220.0 | 88.7 | 136.0 |
| NOC | Northrop Grumman Corp. | 337.73 | 1.5 | 54,879.4 | 17.4 | 25.8 |
| ITW | Illinois Tool Works, Inc. | 156.94 | 2.5 | 49,491.7 | 20.8 | 51.7 |
| WM | Waste Management, Inc. | 116.21 | 1.6 | 49,743.0 | 26.4 | 43.0 |
| EMR | Emerson Electric Co. | 66.81 | 3.0 | 40,196.1 | 18.0 | 53.8 |
| ROP | Roper Technologies, Inc. | 371.77 | 0.5 | 38,515.7 | 34.9 | 16.5 |
| RSG | Republic Services, Inc. | 86.80 | 1.7 | 28,068.0 | 27.2 | 45.9 |
| CMI | Cummins, Inc. | 175.30 | 2.6 | 26,888.6 | 11.3 | 29.8 |
| CTAS | Cintas Corp. | 260.04 | 0.8 | 26,753.7 | 31.5 | 24.9 |
| SWK | Stanley Black & Decker, Inc. | 151.96 | 0.0 | 21,441.8 | 35.1 | 0.0 |
| FAST | Fastenal Co. | 31.74 | 2.7 | 17,569.9 | 23.8 | 64.3 |
| GWW | W.W. Grainger, Inc. | 295.25 | 2.0 | 14,937.7 | 20.8 | 41.9 |
| HRS | Harris Corp. | 189.13 | 1.4 | 22,341.2 | 24.9 | 34.6 |
| LLL | L3 Technologies, Inc. | 245.17 | 1.3 | 19,479.0 | 24.6 | 32.6 |
| ROL | Rollins, Inc. | 34.25 | 1.0 | 12,456.0 | 49.3 | 49.9 |
| CHRW | C.H. Robinson Worldwide, Inc. | 86.34 | 2.3 | 11,364.8 | 17.5 | 40.3 |
| EXPD | Expeditors International of Washington, Inc. | 76.51 | 1.2 | 12,842.9 | 21.3 | 25.7 |
| DOV | Dover Corp. | 97.19 | 2.0 | 14,136.6 | 23.5 | 46.5 |
| JBHT | J.B. Hunt Transport Services, Inc. | 105.72 | 1.0 | 11,006.7 | ||
| NDSN | Nordson Corp. | 142.42 | 1.0 | 7,950.5 | 25.6 | 24.9 |
| RHI | Robert Half International, Inc. | 62.88 | 2.0 | 6,796.9 | 16.7 | 33.6 |
| GGG | Graco, Inc. | 51.05 | 1.2 | 8,347.5 | 24.9 | 29.1 |
| AOS | A. O. Smith Corp. | 44.87 | 1.8 | 6,126.8 | 17.5 | 32.2 |
| CSL | Carlisle Cos., Inc. | 139.80 | 1.2 | 7,407.1 | 22.1 | 26.7 |
| TTC | The Toro Co. | 72.06 | 1.2 | 7,689.9 | 26.1 | 30.7 |
| DCI | Donaldson Co., Inc. | 49.43 | 1.6 | 6,195.3 | 20.4 | 32.8 |
| HUBB | Hubbell, Inc. | 126.52 | 2.6 | 6,779.8 | 18.5 | 47.9 |
| DNB | ||||||
| LECO | Lincoln Electric Holdings, Inc. | 89.37 | 2.0 | 5,348.0 | 19.3 | 39.0 |
| ITT | ITT, Inc. | 64.96 | 0.9 | 5,592.0 | 18.7 | 16.1 |
| HEI | HEICO Corp. | 138.80 | 0.1 | 18,357.6 | 62.3 | 5.9 |
| MSA | MSA Safety, Inc. | 109.26 | 1.4 | 4,120.4 | 36.6 | 52.2 |
| MSM | MSC Industrial Direct Co., Inc. | 72.46 | 3.5 | 3,880.7 | 13.6 | 47.9 |
| HCSG | Healthcare Services Group, Inc. | 23.73 | 2.6 | 2,232.6 | 19.0 | 49.0 |
| RBC | Regal Beloit Corp. | 82.20 | 1.4 | 3,419.9 | 13.7 | 19.3 |
| R | Ryder System, Inc. | 60.04 | 3.7 | 3,076.5 | 11.1 | 41.3 |
| ABM | ABM Industries, Inc. | 41.02 | 1.7 | 2,724.0 | 31.6 | 54.6 |
| BRC | Brady Corp. | 50.00 | 1.7 | 2,648.0 | 20.2 | 34.0 |
| FELE | Franklin Electric Co., Inc. | 46.00 | 1.1 | 2,120.3 | 23.0 | 25.4 |
| MATW | Matthews International Corp. | 34.10 | 2.4 | 1,052.8 | 14.9 | 35.1 |
| MGRC | McGrath RentCorp | 63.96 | 2.2 | 1,527.4 | 18.5 | 41.0 |
| TNC | Tennant Co. | 65.87 | 1.3 | 1,167.4 | 33.4 | 44.6 |
| LNN | Lindsay Corp. | 88.65 | 1.4 | 950.4 | 169.8 | 238.9 |
| GRC | The Gorman-Rupp Co. | 31.26 | 1.7 | 807.0 | 21.7 | 36.6 |
| VSEC | VSE Corp. | 26.14 | 1.2 | 283.6 | 8.2 | 10.1 |
| MSFT | Microsoft Corp. | 139.59 | 1.3 | 1,058,020.5 | 27.3 | 36.3 |
| IBM | International Business Machines Corp. | 149.59 | 4.2 | 132,765.9 | 15.4 | 65.0 |
| ACN | Accenture Plc | 193.35 | 1.4 | 123,885.7 | 26.4 | 37.8 |
| TXN | Texas Instruments Incorporated | 128.47 | 2.4 | 110,877.2 | 22.9 | 53.8 |
| QCOM | QUALCOMM, Inc. | 75.36 | 3.3 | 92,332.4 | 39.7 | 129.5 |
| ADP | Automatic Data Processing, Inc. | 166.39 | 1.8 | 72,744.0 | 37.6 | 66.5 |
| ADI | Analog Devices, Inc. | 123.12 | 1.7 | 43,524.6 | 29.2 | 49.1 |
| XLNX | Xilinx, Inc. | 129.80 | 1.2 | 31,183.2 | 36.9 | 42.8 |
| MCHP | Microchip Technology, Inc. | 99.19 | 1.6 | 22,270.6 | 65.7 | 102.3 |
| MXIM | Maxim Integrated Products, Inc. | 65.23 | 2.9 | 17,102.8 | 27.6 | 79.2 |
| BR | Broadridge Financial Solutions, Inc. | 133.93 | 1.4 | 15,404.7 | 30.8 | 42.3 |
| JKHY | Jack Henry & Associates, Inc. | 136.58 | 1.1 | 10,719.0 | 35.6 | 38.7 |
| BMI | Badger Meter, Inc. | 52.85 | 1.2 | 1,516.6 | 42.2 | 48.6 |
| CASS | Cass Information Systems, Inc. | 48.53 | 1.9 | 696.5 | 23.4 | 44.4 |
| ECL | Ecolab, Inc. | 198.90 | 0.9 | 56,852.9 | 38.8 | 34.2 |
| SHW | The Sherwin-Williams Co. | 490.80 | 0.8 | 41,965.9 | 41.3 | 33.7 |
| APD | Air Products & Chemicals, Inc. | 227.06 | 2.0 | 49,752.3 | 29.4 | 58.1 |
| PPG | PPG Industries, Inc. | 118.21 | 1.6 | 27,634.5 | 23.1 | 38.0 |
| NUE | Nucor Corp. | 56.24 | 2.8 | 17,058.6 | 7.9 | 22.2 |
| IFF | International Flavors & Fragrances, Inc. | 145.18 | 0.0 | 15,157.6 | 41.6 | 0.0 |
| WLK | Westlake Chemical Corp. | 69.26 | 1.4 | 8,676.2 | 11.5 | 16.4 |
| ALB | Albemarle Corp. | 75.58 | 1.9 | 7,753.9 | 11.7 | 22.0 |
| RPM | RPM International, Inc. | 66.16 | 2.1 | 8,526.5 | 32.5 | 68.3 |
| ATR | AptarGroup, Inc. | 123.52 | 1.1 | 7,782.7 | 39.1 | 42.5 |
| SON | Sonoco Products Co. | 60.27 | 2.8 | 5,922.8 | ||
| RGLD | Royal Gold, Inc. | 117.34 | 0.9 | 7,773.9 | 81.5 | 70.7 |
| NEU | NewMarket Corp. | 419.65 | 1.7 | 4,665.3 | 20.2 | 33.9 |
| BMS | Bemis Co., Inc. | 57.25 | 2.2 | 5,221.2 | 22.9 | 49.9 |
| SLGN | Silgan Holdings, Inc. | 30.38 | 1.4 | 3,343.2 | 14.9 | 20.4 |
| SXT | Sensient Technologies Corp. | 69.55 | 2.1 | 2,907.3 | 20.0 | 41.0 |
| KWR | Quaker Chemical Corp. | 191.73 | 0.8 | 2,475.6 | 42.2 | 33.7 |
| FUL | H.B. Fuller Co. | 49.09 | 1.3 | 2,426.2 | 19.4 | 25.5 |
| SCL | Stepan Co. | 93.86 | 1.0 | 2,082.3 | 20.2 | 20.8 |
| CMP | Compass Minerals International, Inc. | 56.02 | 5.3 | 1,853.7 | 30.0 | 157.7 |
| HWKN | Hawkins, Inc. | 44.00 | 2.1 | 460.8 | 19.2 | 40.5 |
| WELL | Welltower, Inc. | 82.86 | 4.2 | 33,630.4 | 88.1 | 369.4 |
| DLR | Digital Realty Trust, Inc. | 117.75 | 3.5 | 24,487.8 | 93.4 | 326.4 |
| O | Realty Income Corp. | 69.52 | 3.9 | 21,678.0 | 51.9 | 201.3 |
| ESS | Essex Property Trust, Inc. | 293.83 | 2.6 | 19,192.6 | 46.4 | 119.6 |
| WPC | W.P. Carey, Inc. | 84.79 | 4.9 | 14,374.7 | 27.9 | 135.9 |
| FRT | Federal Realty Investment Trust | 130.19 | 3.2 | 9,623.8 | 42.9 | 136.8 |
| ELS | Equity LifeStyle Properties, Inc. | 124.31 | 1.9 | 11,055.1 | ||
| NNN | National Retail Properties, Inc. | 52.55 | 3.8 | 8,443.0 | 38.4 | 146.1 |
| OHI | Omega Healthcare Investors, Inc. | 36.83 | 7.2 | 7,828.1 | 27.9 | 201.7 |
| NHI | National Health Investors, Inc. | 79.22 | 5.1 | 3,401.1 | 22.1 | 113.5 |
| SKT | Tanger Factory Outlet Centers, Inc. | 16.71 | 8.7 | 1,511.3 | 19.2 | 167.5 |
| UHT | Universal Health Realty Income Trust | 89.05 | 3.0 | 1,215.7 | 65.1 | 198.2 |
| UBA | Urstadt Biddle Properties, Inc. | 21.47 | 5.1 | 849.1 | 36.5 | 186.6 |
| NEE | NextEra Energy, Inc. | 208.07 | 0.0 | 100,269.8 | 34.0 | 0.0 |
| DUK | Duke Energy Corp. | 87.30 | 4.2 | 64,177.3 | 21.2 | 88.4 |
| D | Dominion Energy, Inc. | 75.20 | 4.5 | 61,188.3 | 35.6 | 159.9 |
| SO | The Southern Co. | 55.37 | 4.3 | 57,745.2 | 16.9 | 73.2 |
| XEL | Xcel Energy, Inc. | 60.34 | 2.5 | 31,245.8 | 24.0 | 61.2 |
| ED | Consolidated Edison, Inc. | 86.40 | 3.3 | 28,399.0 | 19.8 | 65.7 |
| WEC | WEC Energy Group, Inc. | 85.49 | 2.6 | 27,216.0 | 24.8 | 64.5 |
| PPL | PPL Corp. | 30.18 | 5.4 | 21,767.7 | 11.6 | 63.3 |
| ES | Eversource Energy | 76.26 | 2.7 | 24,695.9 | 22.6 | 60.3 |
| EIX | Edison International | 70.64 | 3.5 | 22,702.5 | -63.4 | -221.7 |
| CNP | CenterPoint Energy, Inc. | 28.45 | 3.9 | 14,402.4 | 44.5 | 173.6 |
| CMS | CMS Energy Corp. | 57.99 | 2.5 | 16,540.0 | 26.1 | 65.2 |
| ATO | Atmos Energy Corp. | 106.98 | 1.9 | 12,569.2 | 25.5 | 47.9 |
| LNT | Alliant Energy Corp. | 49.43 | 2.7 | 11,789.0 | 22.5 | 61.3 |
| UGI | UGI Corp. | 50.30 | 2.1 | 8,714.9 | 22.7 | 47.3 |
| OGE | OGE Energy Corp. | 42.34 | 3.3 | 8,539.5 | 20.3 | 67.9 |
| WTR | Aqua America, Inc. | 40.61 | 2.1 | 8,871.2 | 45.9 | 96.3 |
| VVC | ||||||
| MDU | MDU Resources Group, Inc. | 26.00 | 3.1 | 5,191.8 | 18.9 | 57.6 |
| NFG | National Fuel Gas Co. | 48.25 | 3.5 | 4,168.6 | 14.1 | 49.7 |
| NJR | New Jersey Resources Corp. | 49.35 | 2.3 | 4,401.4 | 33.8 | 78.9 |
| SWX | Southwest Gas Holdings, Inc. | 88.68 | 2.3 | 4,727.8 | 23.2 | 54.4 |
| POR | Portland General Electric Co. | 54.71 | 2.7 | 4,863.7 | 22.1 | 59.0 |
| BKH | Black Hills Corp. | 78.21 | 2.5 | 4,786.6 | 19.7 | 48.8 |
| SR | Spire, Inc. (Missouri) | 84.76 | 2.7 | 4,298.2 | 19.3 | 52.7 |
| NWE | NorthWestern Corp. | 70.46 | 3.1 | 3,587.8 | 16.8 | 52.4 |
| APU | AmeriGas Partners LP | 33.68 | 11.4 | 3,107.1 | 58.6 | 666.3 |
| SJI | South Jersey Industries, Inc. | 33.26 | 3.4 | 3,045.1 | -185.3 | -638.1 |
| AWR | American States Water Co. | 76.05 | 1.4 | 2,800.5 | 42.7 | 60.5 |
| CWT | California Water Service Group | 52.86 | 1.4 | 2,541.5 | 46.1 | 66.4 |
| MGEE | MGE Energy, Inc. | 73.37 | 1.8 | 2,521.1 | 28.8 | 52.9 |
| NWN | Northwest Natural Holding Co. | 70.90 | 2.7 | 2,148.9 | 30.9 | 82.8 |
| SJW | SJW Group | 64.17 | 1.8 | 1,826.1 | 32.3 | 57.3 |
| CPK | Chesapeake Utilities Corp. | 90.86 | 1.6 | 1,482.0 | 25.5 | 41.7 |
| MSEX | Middlesex Water Co. | 59.70 | 1.5 | 986.9 | 28.4 | 44.0 |
| CTWS | Connecticut Water Service, Inc. | 69.54 | 1.8 | 838.4 | 41.2 | 74.0 |
| PH | Parker-Hannifin Corp. | 177.19 | 1.8 | 21,845.7 | 16.0 | 28.5 |
| FMCB | Farmers & Merchants Bancorp (California) | 802.00 | 1.7 | 631.2 | 13.0 | 22.4 |
| ABBV | AbbVie, Inc. | 67.72 | 6.0 | 100,529.2 | 19.4 | 115.9 |
| BF.B | Brown-Forman Corp. | 55.81 | 1.2 | 26,345.3 | 32.0 | 37.6 |
| LIN | Linde Plc | 203.61 | 1.6 | 110,496.3 | 19.0 | 31.2 |
| PNR | Pentair Plc | 39.18 | 2.3 | 6,463.1 | 23.0 | 53.9 |
| Ticker | Name | Price | Dividend Yield | Market Cap ($M) | P/E Ratio | Payout Ratio |
In addition to the Excel spreadsheet above, this article covers our top 10 best blue chip stock buys today as ranked using expected total returns from The Sure Analysis Research Database.
We also cover the 10 highest yielding blue chip stocks in this article, and provide a sortable table of all blue chip stocks for quick reference.
The table of contents below allows for easy navigation.
Table of Contents
-
The 10 Best Blue Chip Stocks Today
#10: AT&T Inc. (T)
#9: Altria Group (MO)
#8: Occidental Petroleum (OXY)
#7: Ryder Systems, Inc. (R)
#6: Ameriprise Financial (AMP)
#5: Walgreens Boots Alliance (WBA)
#4: MSC Industrial Direct (MSM)
#3: Bank OZK (OZK)
#2: Lazard Ltd. (LAZ)
#1: AbbVie Inc. (ABBV)
-
The 10 Blue Chip Stocks With The Highest Dividend Yields
#10: PPL Corporation (PPL)
#9: Helmerich & Payne (HP)
#8: Invesco Ltd. (IVZ)
#7: AbbVie Inc. (ABBV)
#6: AT&T Inc. (T)
#5: Occidental Petroleum (OXY)
#4: Altria Group (MO)
#3: Taubman Centers, Inc. (TCO)
#2: Omega Healthcare Investors (OHI)
#1: Tanger Factory Outlet Centers (SKT)
Looking for even more information and ideas for blue chip stocks? Watch the video below.
The Complete List of Blue Chip Stocks
The table below includes relevant data on all 271 blue chip stocks (as defined earlier in this article.
| 1 | AAN | $49.72 | 0.20% | $3,609.00 | 18.20 | 4.40% |
| 2 | ABBV | $95.98 | 4.00% | $145,340.00 | 14.20 | 56.80% |
| 3 | ABC | $89.97 | 1.70% | $19,466.00 | 14.40 | 24.30% |
| 4 | ABM | $31.72 | 2.20% | $2,085.00 | 19.70 | 43.50% |
| 5 | ABT | $66.84 | 1.70% | $117,259.00 | 24.60 | 41.20% |
| 6 | ACN | $169.07 | 1.60% | $108,444.00 | 26.50 | 41.80% |
| 7 | ADI | $98.85 | 1.90% | $36,740.00 | 17.70 | 34.40% |
| 8 | ADM | $50.40 | 2.70% | $28,211.00 | 17.00 | 45.10% |
| 9 | ADP | $146.75 | 1.90% | $64,289.00 | 38.00 | 71.50% |
| 10 | AEL | $37.09 | 0.70% | $3,348.00 | 10.40 | 7.30% |
| Ticker | Price | Dividend Yield | Market Cap ($M) | P/E Ratio | Payout Ratio |
Additionally, you can download the data from this table as a detailed Excel spreadsheet below:
Click here to download your Excel spreadsheet of all 271 blue chip stocks, including metrics that matter like dividend yield and the price-to-earnings ratio.
The spreadsheet and table above give the full list of blue chips. They are a good place to get ideas for your next high quality dividend growth stock investment…
Our top 10 favorite blue chip stocks are analyzed in detail below.
The 10 Best Blue Chip Buys Today
The 10 best blue chip stocks as ranked by expected total return from The Sure Analysis Research Database (exluding REITs and MLPs) are analyzed in detail below.
#10: AT&T Inc. (T)
- Dividend History: 35 years of consecutive increases
- Dividend yield: 6.1%
AT&T is a global provider of communications and digital entertainment services, offering internet access, wireless cellular and TV services. The company was born in its current form via a spin-off in 1984 and today, it creates $173 billion in annual revenue, driving a market capitalization of $245 billion.
On April 24th, 2019 AT&T reported Q1 2019 results for the period ending March 31st, 2019. For the quarter the company generated $44.8 billion in revenue, up 17.8% from the year-ago quarter, primarily driven by the Time Warner acquisition. On a pro-forma basis including WarnerMedia, revenue would have been down 0.9%, as a 2.9% increase in Wireless Service revenue was offset by declines in the Entertainment Group, Business Wireline and Latin America. Adjusted earnings-per-share totaled $0.86 against $0.85 in the prior period.
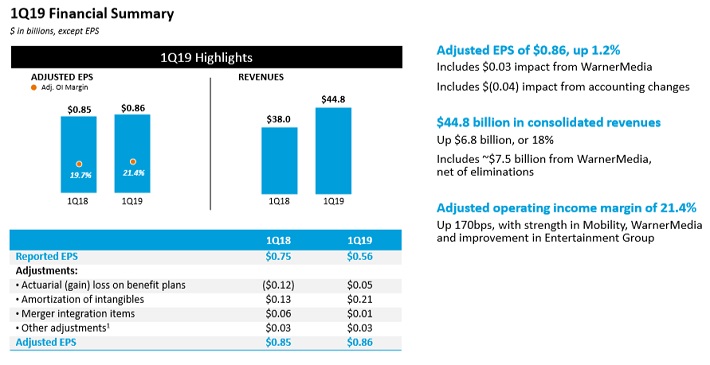
Source: Earnings Slides
Previously, AT&T provided an outlook for 2019 anticipating low single-digit adjusted EPS growth, a dividend payout ratio below 60% and end-of-year net debt to adjusted EBITDA that was expected to be in the 2.5x range. As of the most recent report, net debt stood at $169 billion, with a net debt to adjusted EBITDA ratio of 2.8x.
This number is expected to come down to ~$165 billion in quick order as a result of Hulu deal and Hudson Yards transaction. The company says that it is on pace to get its debt down to ~$150 billion by year-end and is on track to reach the 2.5x mark
AT&T’s competitive advantage is in its enormous scale in the United States and parts of Latin America. The company uses that scale to push wireless, TV, and internet services to millions of consumers in a bid to expand relationships already in place. This diversification of AT&T’s legacy businesses and the content library of WarnerMedia is a core advantage AT&T possesses over its rivals, namely Verizon (VZ).
The company’s dividend is obviously a significant draw for investors as the yield is in excess of 6%. The payout is well-covered by earnings and cash flow, so we anticipate the ample yield will be safe for many years to come, and should continue to grow as well.
AT&T stock trades for a 2019 P/E ratio of 9.4. Our fair value estimate is a P/E ratio of 12. An expanding P/E multiple could increase annual returns by 5% per year over the next five years.
In total, we are forecasting annual shareholder returns above 14% per year, consisting of the company’s 6% yield, low single-digit earnings-per-share growth (~3.1%) and a significant tailwind from a rising valuation. We rate the shares a buy given these factors, as AT&T looks attractive from a value and yield perspective.
#9: Altria Group (MO)
- Dividend History: 53 increases in the past 49 years
- Dividend yield: 6.5%
Altria Group is a consumer products giant. Its core tobacco business holds the flagship Marlboro cigarette brand. Altria also has non-smokable brands Skoal and Copenhagen chewing tobacco, Ste. Michelle wine, and owns a 10% investment stake in global beer giant Anheuser Busch Inbev (BUD).
Related: The Best Tobacco Stocks Now, Ranked In Order
In late April (4/25/19) Altria reported first-quarter earnings. Revenue, net of excise taxes, declined 6.0% for the quarter, due primarily to falling shipment volumes. Adjusted earnings-per-share declined 5.3% for the first quarter. The decline in Altria’s shipment volumes is because of the long-running trend of consumers quitting cigarettes in the United States.
This is not unexpected, as Altria itself sees the U.S. smoking rate continuing to decline.
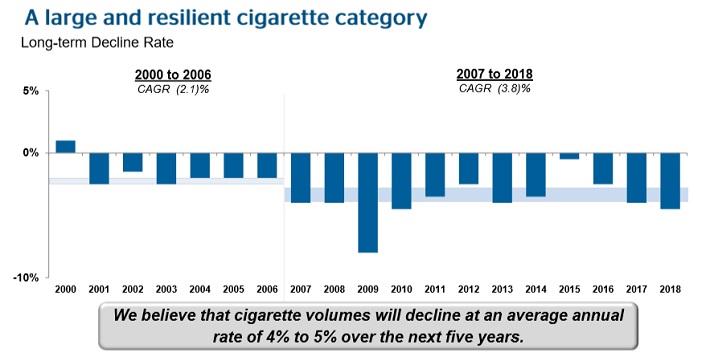
Source: 2019 CAGNY Presentation
Fortunately, Altria has a plan to continue generating growth over the long term, even in an environment of declining smoking rates. Altria recently announced a $1.8 billion investment in Canadian marijuana producer Cronos Group, in which it purchased a 45% equity stake in the company, as well as a warrant to acquire an additional 10% ownership interest in Cronos Group at a price of C$19.00 per share, exercisable over four years from the closing date.
Separately, Altria invested nearly $13 billion in e-vapor manufacturer JUUL Labs for a 35% equity stake in the company, valuing JUUL at $38 billion. These two investments give Altria access to two huge growth opportunities, marijuana and vaping.
Altria reaffirmed its guidance for 2019 full-year adjusted diluted EPS to be in a range of $4.15 to $4.27, which would be 4% to 7% growth from 2018.
The video below examines Altria’s dividend safety in detail.
Altria’s dividend is highly secure. The company has a target payout ratio of 80% of annual adjusted EPS. This provides a compelling shareholder payout while leaving sufficient room to invest in growth.
Altria is also highly resistant to recessions. Cigarette and alcohol sales fare very well during recessions, which keeps Altria’s strong profitability and dividend growth intact. With a target dividend payout of 80%, Altria’s dividend is secure.
The combination of EPS growth (4%), expansion of the P/E ratio (5.1%), and dividends (6.5%) leads to expected returns of 15.6% per year over the next five years.
#8: Occidental Petroleum (OXY)
- Dividend History: 15 years of consecutive increases
- Dividend yield: 6.1%
Occidental Petroleum is an international oil and gas exploration and production company with operations in the U.S., the Middle East, and Latin America. It has a market capitalization of $39 billion. It is primarily an upstream exploration and production company, although the company does have a midstream and a chemical segments.
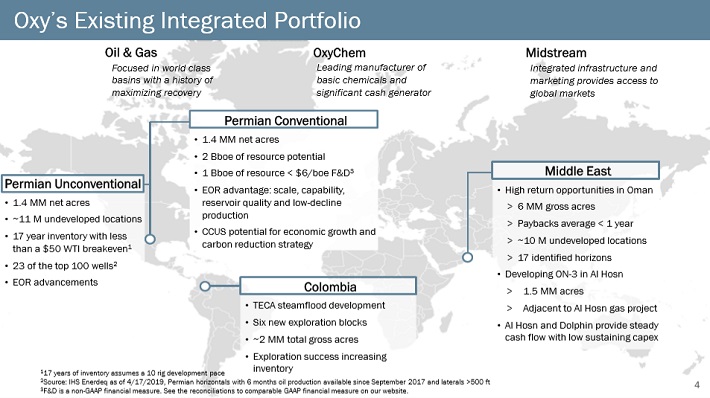
Source: Investor Presentation
Occidental is primarily an exploration and production company, which leverages the company’s profits to the price of oil and gas. In early May, Occidental reported (5/5/19) financial results for the first quarter of fiscal 2019. Total production grew 3% sequentially and 18% on an annual basis.
Production in the Permian grew 4% sequentially and 47% on an annual basis. However, core earnings-per-share fell 31%, from $1.22 in the previous quarter to $0.84, primarily due to lower realized prices of oil and natural gas.
Management expects 9%-11% production growth this year, with more than 30% growth in Permian Resources. The company’s growth will be accelerated if it succeeds in its $38 billion takeover attempt of fellow exploration and production company Anadarko Petroleum (APC).
Occidental pursued this acquisition thanks to the promising asset base of Anadarko in Permian, which will enhance the already strong presence of Occidental in the area, and the $3 billion annual synergies it expects to achieve from the integration of the two companies.
There are great concerns that the deal will stretch the balance sheet of the company. Moody’s has stated that it will probably downgrade the company from A3 to B-. Occidental has already agreed to sell many non-core assets of Anadarko (LNG and off-shore assets in Mozambique) to Total for $8.8 billion. Occidental has also secured $10 billion funding from Berkshire Hathaway in exchange for preferred shares. Due to these concerns, the market has punished the stock harshly, sending it to a 10-year low level.
Occidental stock trades for a 2019 P/E ratio of 12.9, compared to our fair value estimate of 13.8 which is equal to the 10-year average valuation of the stock. Based on this, expansion of the valuation multiple could fuel annual returns of 1.4% over the next five years
In addition to 8.4% expected EPS growth and the 6.1% dividend yield, annual returns could reach nearly 16% per year over the next five years.
#7: Ryder System, Inc. (R)
- Dividend History: 10 years of consecutive increases
- Dividend yield: 4.0%
Ryder is a commercial fleet management, dedicated transportation, and supply chain solutions company. Ryder provides commercial truck rental, truck leasing, used trucks for sale, and last mile delivery services. The stock has a market capitalization of $3 billion.
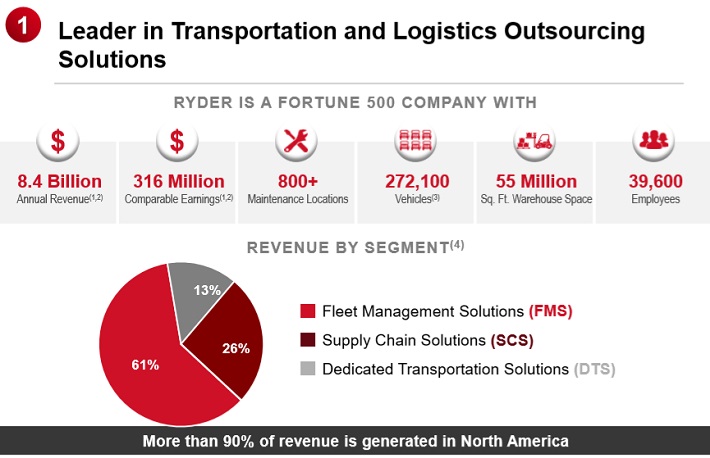
Source: Investor Presentation
Ryder got off to a fast start to 2019. First-quarter revenue increased 15%, while adjusted EPS increased 16% for the period. Growth was boosted by new business and higher volumes.
By segment, Fleet Management Solutions revenue was $1.35 billion, up 9% compared with $1.24 billion in the year-earlier period. Dedicated Transportation Solutions revenue grew 17% to $350 million while Supply Chain Solutions revenue increased 28% year-over-year.
Coming off a strong first-quarter performance, Ryder raised its quarterly dividend by 3.7%. The upcoming dividend payment will be Ryder’s 172nd consecutive quarterly cash dividend, representing over 43 years of uninterrupted dividend payments.
The company performed above its own expectations for the most recent quarter, which prompted company management to raise guidance for the remainder of the year. Ryder expects full-year 2019 comparable EPS from continuing operations in a range of $6.05 to $6.35, up from the prior forecast of $6.00 to $6.30.
In 2018, full-year comparable EPS was $5.97. As a result, Ryder is expected to generate approximately 4% EPS growth in 2019.
Based on expected 2019 EPS of $6.25, Ryder stock trades for a price-to-earnings ratio of 9.1. Our fair value estimate is a P/E ratio of 14, which would represent a 9.0% annual tailwind for shareholder returns over the next five years.
Combined with 3% expected EPS growth and the 4% dividend yield, Ryder stock has total expected returns of 16% per year through 2024.
#6: Ameriprise Financial (AMP)
- Dividend History: 15 years of consecutive increases
- Dividend yield: 2.6%
Ameriprise Financial operates in the financial sector. It is an asset manager, with a market capitalization of approximately $20 billion, with nearly 10,000 employees and $891 billion in assets under management. Ameriprise Financial’s operating segments include Advice & Wealth Management, Asset Management, Annuities, and Protection (insurance products).
In late April (4/24/19) Ameriprise Financial released strong financial results for the 2019 first quarter. Revenue of $3.12 billion increased 0.6% from the same quarter last year, and beat analyst expectations by $90 million. Adjusted earnings-per-share of $3.75 beat expectations by $0.09 per share, and increased 2% year-over-year.
Ameriprise’s steady growth over the past several years has been due largely to its growth in assets under management. The company maintains an optimistic forecast for global AUM through the end of 2020 as well.
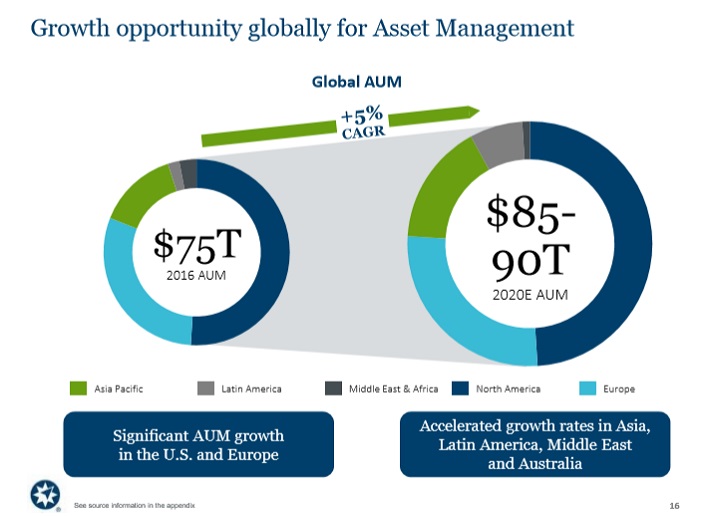
Source: Earnings Slides
Earnings in the Advice & Wealth Management segment increased 11% last quarter, thanks to improved market performance and higher client transactions. Ameriprise also announced a new round of capital returns to shareholders. The company approved a new $2.5 billion share repurchase authorization through 2021, and also raised its dividend by 8%.
Ameriprise Financial’s biggest competitive advantage is its brand strength within the asset management industry. Strong financial performance is critical to retaining and growing its assets under management. That said, Ameriprise Financial is not immune to recessions. Ameriprise’s earnings-per-share declined 13% from 2007-2009, during the Great Recession. Fortunately, the company snapped back in 2010 with 42% earnings growth.
Ameriprise’s dividend appears to be highly secure. Using expected EPS of $15.30 for 2019, Ameriprise is likely to have a dividend payout ratio of 25% for the year.
Ameriprise’s future growth will be derived from rising AUM and share repurchases. Ameriprise recently announced the divestment of its Ameriprise Auto & Home business for $950 million in proceeds. The company will use the proceeds to pay down debt and repurchase stock, both of which will help grow future EPS. We expect 8% annual EPS growth through 2024.
The combination of valuation changes, expected EPS growth, and the 2.6% dividend yield fuels expected annual returns of approximately 16% through 2024.
#5: Walgreens Boots Alliance (WBA)
- Dividend History: 44 years of consecutive increases
- Dividend yield: 3.3%
Walgreens Boots Alliance is a leading pharmacy retailer, with over 18,500 stores in 11 countries. It also operates one of the largest global pharmaceutical wholesale and distribution networks in the world, with more than 390 centers that deliver to nearly 230,000 pharmacies, doctors, health centers and hospitals each year.
You can view a longer discussion of Walgreens’ dividend safety in the following video:
In late June, Walgreens reported financial results for its fiscal third quarter. Walgreens’ results continued to show the industry challenges remain intact, but investors were at least relieved that the company was able to beat expectations. Walgreens surpassed analyst expectations for both revenue and adjusted earnings-per-share last quarter, showing signs of stabilization.
Prescriptions increased 2% and revenue increased 1% for the quarter. Retail pharmacy USA sales, which represents Walgreens’ biggest business, increased 3% for the quarter, on an adjusted basis.
Adjusted operating income fell 12% due to lower pharmacy margins, which were caused by reimbursement pressure, and lower front of store sales in the U.S.
Walgreens continues to be challenged by lower reimbursements and weak store traffic, but fortunately the pharmacy business remains healthy. Walgreens grew its retail pharmacy sales by more than 7% last quarter. Prescriptions and pharmacy retail will likely continue to generate growth, thanks to the the aging U.S. population and the corresponding need for health care.
Walgreens also has a plan to revitalize performance in its core retail pharmacy operation, through investments in digital capabilities and a renewed focus on cost efficiency. Walgreens plans to significantly cut costs in order to restore profit growth.
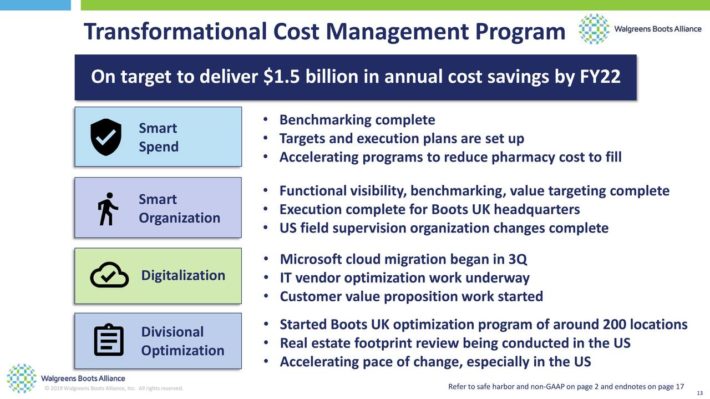
Source: Investor Presentation
While e-commerce retailers are a persistent threat, Walgreens still possesses durable competitive advantages. First, Walgreens has leading market share in pharmacy retail with thousands of store locations that provide convenience to consumers. This brand strength means customers keep coming back to Walgreens, providing the company with stable sales and growth.
Walgreens is also a strong long-term dividend growth stock, because of its recession-resistant business model. Consumers typically cannot forego purchasing medicine and filling prescriptions, even during a recession. Walgreens increased its adjusted earnings-per-share from 2007 through 2010, during the Great Recession.
Walgreens stock trades for a P/E ratio of 9.3x, which is significantly below our fair value estimate of 13.0x. Expansion of the valuation multiple could fuel 6.9% annual returns, as will expected EPS growth of 6% and the 3.2% dividend yield. Total returns are expected to exceed 16% per year through 2024.
#4: MSC Industrial Direct (MSM)
- Dividend History: 16 years of consecutive increases
- Dividend yield: 4.2%
MSC Industrial Direct is one the largest direct marketers and distributors of metalworking and maintenance, repair and operations (MRO) products in North America. The company has 12 fulfillment centers (8 in the U.S., 3 in Canada and 1 in the U.K.) and 100 branch offices, 99 of which are in the U.S.
MSC recently reported financial results for its fiscal 2019 third quarter. Net sales increased 4.6% year-over-year, with acquisitions accounting for over half this growth. Diluted EPS increased 3.6% for the quarter. On the positive side, MSC reported continued growth, but the results were below expectations.
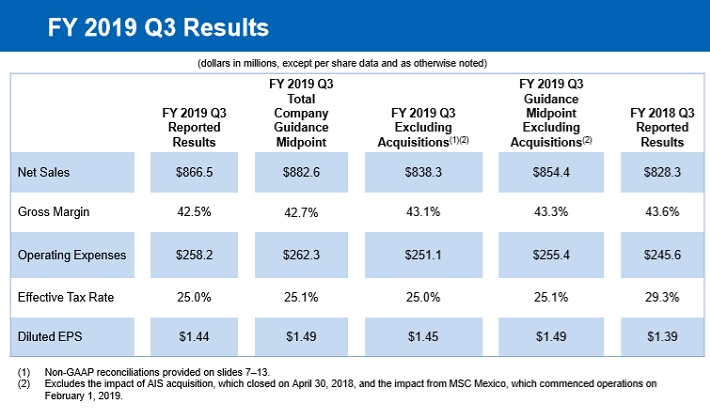
Source: Earnings Slides
Company management acknowledged weaker demand in April as well as pricing uncertainty due to lingering trade concerns. That said, MSC increased its quarterly dividend by 19% along with providing quarterly results. The company expects to generate growth in the current quarter as well. For the fiscal fourth quarter, MSC expects sales growth of 2.2% at the midpoint of guidance.
MSM’s competitive advantage stems from its superior scale and execution. The company has over 1.6 million SKUs and yet boasts of a 99% same day order fulfillment rate (against an industry average of 60%). It is true that Amazon is a formidable threat, but thus far MSM has been able to ward off attacks through its niche market relationships. We continue to view these threats as minimal, and maintain a positive long-term growth outlook.
MSM’s most important growth catalysts include economic growth as well as price increases. In addition, larger customers are starting to consolidate vendors and focus on nationwide suppliers like MSM, which is a positive indicator of future growth.
Based on expected EPS of $5.41 for 2019, MSM stock trades for a price-to-earnings ratio of 13.4. Our fair value estimate for the stock is a price-to-earnings ratio of 18. Expansion of the P/E ratio could boost annual returns by 6.1% per year through 2024. Combined with 6% expected EPS growth and the 4.2% current dividend yield, MSM stock has total expected returns of 16.3% per year through 2024.
#3: Bank OZK (OZK)
- Dividend History: 23 years of consecutive increases
- Dividend yield: 3.1%
Bank OZK, previously called Bank of the Ozarks, is a regional bank, which means it focuses its operations heavily in specific regions of the country. In this case, Bank OZK operates in Arkansas, Florida, North Carolina, Texas, Alabama, South Carolina, New York and California.
Bank OZK offers traditional banking services including checking, business banking, commercial loans, and mortgages. The stock has a market capitalization of $3.8 billion.
On April 17th, 2019 Bank OZK reported operating results for its 2019 first quarter. For the quarter, total interest income increased 15% year over year. Net income declined 2.2% to $110.7 million, as expenses increased faster than revenue.
Earnings-per-share came in at $0.86, a 2.3% decline compared to $0.88 in the year ago period. Returns on average assets, stockholders’ equity and tangible equity all declined modestly in the 2019 first quarter. Still, total loans increased 5.2% while tangible book value increased 22% to $24.73 per share.
We expect 8% annual earnings growth for the company over the next five years, comprised mainly of loan growth. Growth could be higher if not for the recent turn in Federal Reserve policy. The Fed has suspended interest rate increases, and may lower rates if the U.S. economy slows down. Rising interest rates are a positive catalyst for banks, although the continued growth of the U.S. economy should still provide a supportive environment for growth.
Bank OZK has generated consistent net interest income growth over the past five years. In fact, Bank OZK reported record net interest income in 17 of the past 20 quarters.
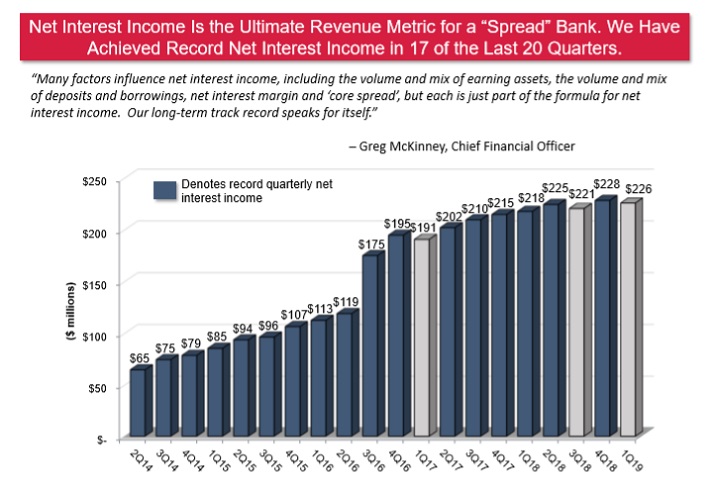
Source: Investor Presentation
Bank OZK is an attractive stock for value and income.
First, shares appear to be undervalued. Bank OZK is expected to generate EPS of $3.50 for 2019, equaling a P/E ratio of 8.3x. Our fair value estimate is a P/E ratio of 12.0x, which would result in a 7.7% positive impact to shareholder returns each year.
The stock also has a 3.1% dividend yield, and expected EPS growth of 8% per year, leading to total expected returns of nearly 19.0% per year over the next five years.
#2: Lazard Ltd. (LAZ)
- Dividend History: 12 years of consecutive increases
- Dividend yield: 5.3%
Lazard Ltd. is an international investment firm with two business segments, Financial Advisory and Asset Management. The Financial Advisory business includes M&A, restructuring, and other corporate financial services. The Asset Management business is about 80% equities and focuses primarily on institutional clients.
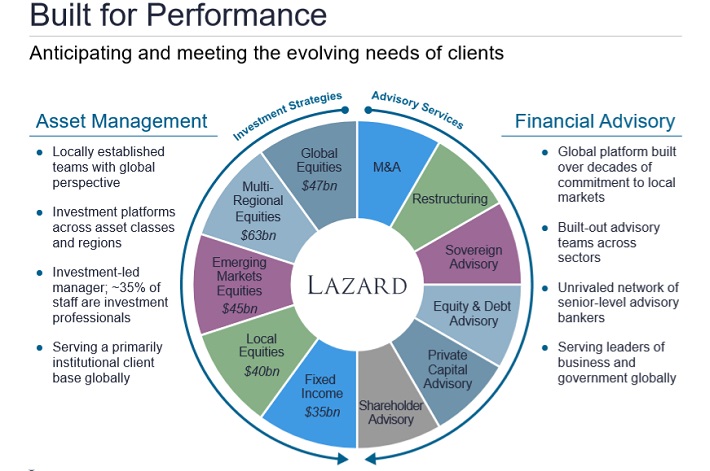
Source: Investor Presentation
By geography, Lazard’s revenue is about 60% Americas, 30% Europe and Middle East, 10% Asia Pacific. Revenue is almost 50% Financial Advisory and 50% Asset Management.
At the end of the 2019 first quarter, Lazard had roughly $235 billion in assets under management (AUM). The company reported Q1 financial results that beat both revenue and adjusted earnings per share estimates. However, revenue was down 14% to $661.7 million, while diluted GAAP EPS declined 34% on a year-over-year basis.
Lazard’s asset management business saw 9% growth to $235 billion AUM on a sequential quarterly basis due to favorable market performance. However, AUM was down 7% on year-over-year basis. The Financial Advisory segment saw mixed performance. The company saw lower operating revenue in Europe and Asia that was partly offset by higher operating revenue in the Americas.
We expect Lazard to generate EPS of $4.16 for 2019. Based on this, the stock trades for a P/E ratio of 8.6. In the past 10 years, the stock had an average P/E ratio of 15.7. Our fair value estimate is a P/E ratio of 15, which would provide an 11.8% annual boost to shareholder returns if realized over the next five years.
In addition, Lazard is expected to grow EPS by 5% per year. Lastly, the stock has a dividend yield of 5.3%, leading to total annual returns of 22.1% per year over the next five years.
#1: AbbVie Inc. (ABBV)
- Dividend History: 47 years of consecutive increases
- Dividend yield: 6.1%
AbbVie is a pharmaceutical giant with over $32 billion in annual revenue. Going back to its days as a subsidiary of former parent company Abbott Laboratories (ABT) in 2013, AbbVie has increased its dividend for over 40 years.
Today, AbbVie is a huge company on its own. AbbVie stock has a market capitalization of $104 billion.
Related: The Top 11 Big Pharma Stocks Now, Ranked In Order
AbbVie has generated tremendous growth since being spun off from Abbott. In the years since, AbbVie generated compound annual revenue growth of 11.7% and adjusted EPS growth above 20% per year.
Investors are concerned with AbbVie’s future growth potential, especially since its flagship drug Humira–the top-selling drug in the world–has lost patent exclusivity in Europe. This caused AbbVie’s international sales of Humira to decline 23% last quarter.
AbbVie will lose patent exclusivity of Humira in the U.S. in 2023, meaning the company needs to invest sufficiently to prepare for this event. Fortunately the company has done just that. It recently announced the $63 billion acquisition of Botox-maker Allergan plc (AGN).
Allergan has a large product portfolio of its own, including its most well-known product Botox.
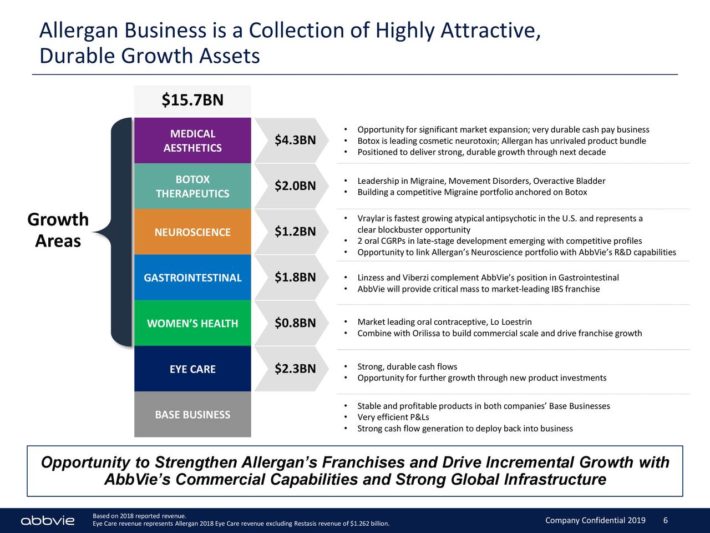
Source: Investor Presentation
The acquisition accomplishes a number of strategic goals for AbbVie, such as broadening and diversifying its product offerings by adding exposure to new segments. It also enhances AbbVie’s position in multiple existing categories. The deal instantly makes AbbVie a global powerhouse. The combined company will have annual revenues of nearly $50 billion, based on 2018 results.
Profit growth will also follow, as AbbVie expects the transaction to be 10% accretive to adjusted earnings-per-share over the first full year following the close of the transaction, with peak accretion of greater than 20%. Moreover, AbbVie expects the return on invested capital of the transaction to exceed AbbVie’s cost of capital within the first full year.
One concern for investors is the impact of elevated debt levels. AbbVie had $36.6 billion of total debt at the time of its most recent quarterly earnings release. The company is committed to a Baa2/BBB or better credit rating. AbbVie also issued a new debt reduction target of $15 billion to $18 billion by 2021.
AbbVie stock has a current dividend yield of 6.1%, a very high yield resulting from both a declining share price and the company’s high rate of dividend growth. We believe AbbVie’s dividend is highly secure, as discussed in greater detail in the video below.
AbbVie has a highly impressive track record of dividend increases. We believe the company will continue to raise its dividend each year going forward, thanks to its expected EPS growth and its modest payout ratio of 49% for 2019.
AbbVie is expected to grow EPS by 9%-10% over the next five years. We also view the stock as significantly undervalued, with a 2019 P/E ratio of 8.0 compared with our fair value estimate of 13. The combination of EPS growth, dividends, and multiple expansion is expected to fuel total returns of nearly 26% per year over the next five years.
The 10 Blue Chip Stocks with The Highest Dividend Yields
The 10 blue chip stocks with the highest dividend yields are analyzed in detail below. These stocks combine the safety that comes with being a blue chip, with high yields. MLPs are excluded from the list below, but REITs are included.
#10: PPL Corporation (PPL)
- Dividend History: 18 years of consecutive increases
- Dividend yield: 5.4%
Pennsylvania Power & Light Company, now called PPL Corporation, is a utility company with more than 10 million people in the United States and the United Kingdom. PPL is the parent company of seven regulated utility companies and provides electricity to customers in the U.K., Pennsylvania, Kentucky, Virginia and Tennessee. PPL also delivers natural gas to customers in Kentucky.
With a market capitalization of $22 billion, PPL is one of the largest purely regulated utility companies in the U.S., with an industry-leading dividend yield. And, PPL has a long history of consistent dividend payouts and reliable growth.
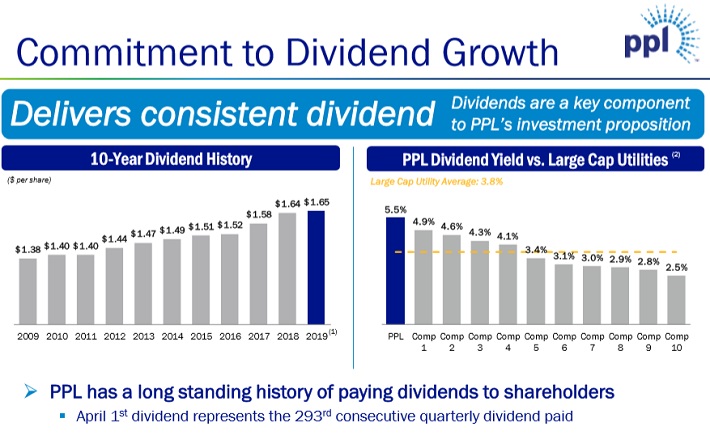
Source: Investor Presentation
PPL released first quarter financial results on May 2nd, 2019. Adjusted earnings-per-share came to $0.70 during the quarter, which missed estimates by $0.03 and showed a decline of 5.4% from the previous year. Revenue decreased 2.2% to $2.1 billion, which was $107 million below expectations.
The decrease on the top and bottom lines were due to lower results at the company’s U.S. operations, which had an 18% decline in profitability from the previous year. The Kentucky Regulated division declined 16% due to higher operational and maintenance expenses. The Pennsylvania segment was down 19% on lower gross margins.
One positive development was that regulators in Kentucky authorized a revenue increase that took place on 5/1/2019. In contrast to U.S. operations, PPL’s U.K segment performed quite well. A rate increase that took effect in 2018 helped drive a 29% increase in profitability for the region. PPL reaffirmed its midpoint for adjusted earnings-per-share of $2.40 for 2019. PPL expects its U.S. business to decline 5.8% from 2018 with the U.K. segment seen improving 2.9%.
We expect 2% annual EPS growth for PPL over the next five years. As a utility, the company provides a necessary service and should see at least modest EPS growth, simply due to population growth and rate increases.
The stock trades for a 2019 P/E ratio of 12, which is above our fair value estimate of 10. As a result, we view the stock as overvalued, and therefore the overall expected returns are in the low single-digits. Still, PPL is an attractive stock purely from the perspective of income, as the stock has a dividend yield above 5% and a long history of dividend increases.
#9: Helmerich & Payne (HP)
- Dividend History: 47 years of consecutive increases
- Dividend yield: 5.5%
Helmerich & Payne provides contract drilling services primarily to inland oil and gas producers in the U.S. It is the market leader in the U.S., with a market cap above $6 billion.
The company is a leading unconventional driller in the United States.
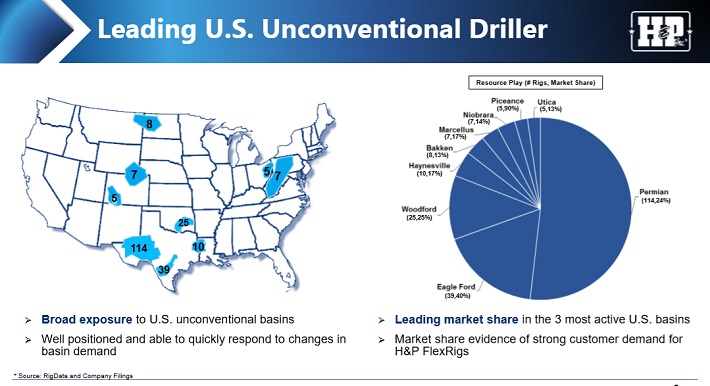
Source: Investor Presentation
The company incurred losses in 2016 and 2017 due to the downturn of the oil market, which began almost five years ago. As the price of oil began to plunge, oil producers reduced their production activities and thus adversely affected Helmerich & Payne’s business.
In late April, Helmerich & Payne reported (4/24/19) financial results for the second quarter of fiscal 2019 (ending 3/31/19). The company maintained its positive momentum and posted its third consecutive quarterly profit after a long series of losses. Revenues decreased 3% sequentially but adjusted earnings-per-share grew from $0.42 in Q1-2019 to $0.56 in Q2-2019.
The strong performance resulted from the U.S. land operations segment, which grew its operating income by 23%, from $79.6 million to $106.1 million. This segment enjoyed 2% sequential growth in average rig revenue per day. As the U.S. land operations generated 89% of total operating income, it is easy to understand the importance of this segment. The company converted another 9 rigs to the super-spec type, where it sees strong demand and higher margins, and will continue to convert rigs to this category.
Helmerich & Payne is in the early phases of a strong multi-year recovery. The company will enjoy strong growth in the next five years. Given expected total assets of ~$6.5 billion in 2024 and a reasonable ratio of gross profit/assets around 20%, a gross profit around $1.34 billion can be expected. As the net income has been about 40% of the gross profit in the last few profitable years of the company and the share count is expected around 112 million, the company is likely to earn about $4.60 per share in 2024.
We view Helmerich & Payne stock as a hold and not a buy, due to its highly volatile EPS in the past decade. That said, the stock has a high dividend yield of 5.5% and a very long history of annual dividend increases, which gives it broad appeal for income-focused investors.
#8: Invesco Ltd. (IVZ)
- Dividend History: 10 years of consecutive increases
- Dividend yield: 6.2%
Invesco is an asset management. giant Invesco is a global investment management firm. It has more than 7,000 employees and serves customers in more than 150 countries.
In late April (4/25/19) Invesco reported financial results for the 2019 first quarter. The first quarter was difficult for Invesco, as revenue and adjusted EPS declined 7% and 16%, respectively. The culprit for this was a decline in AUM to close out the year, as the global stock indexes dropped significantly in December 2018.
Fortunately, AUM has recovered in 2019. Through March 31st, Invesco’s AUM has increased 7.5% year-to-date.
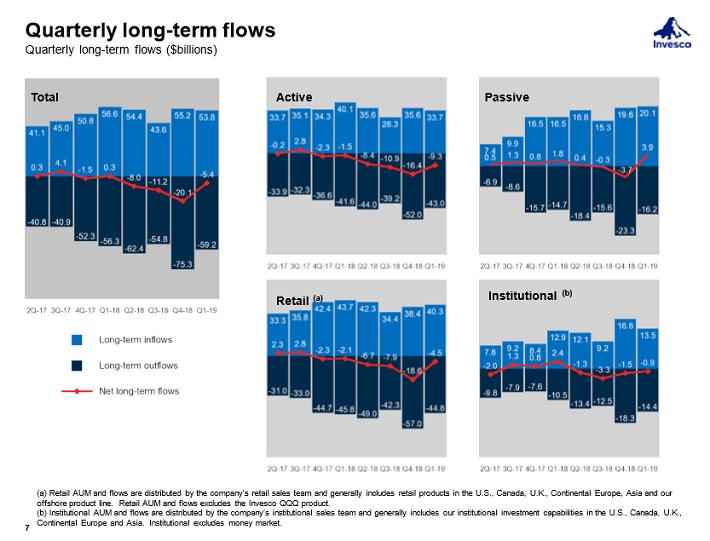
Source: Earnings Slides
The continued strong performance of the U.S. stock market is a positive indicator for the remainder of 2019 as far as AUM. Invesco is also investing heavily in growth, mainly through acquisitions.
First, Invesco acquired OppenheimerFunds for ~$5.7 billion. This acquisition is expected to boost earnings-per-share by ~18% in 2019. Acquiring OppenheimerFunds grew Invesco into the 6th-largest U.S. retail investment management company by AUM.
Invesco also acquired the ETF business from Guggenheim Investments for $1.2 billion. Invesco also made a significant investment in financial technology with its acquisition of Intelliflo, a leading technology platform for financial advisors that supports approximately 30% of all financial advisors in the U.K. Overall, we conservatively expect 5% earnings growth annually for Invesco over the next five years.
Invesco ranks well in terms of dividend safety with an expected payout ratio of 53% for fiscal 2019. This should allow the company to continue increasing its dividend on an annual basis going forward. Invesco also has a strong balance sheet, with a credit rating of ‘A’ from Standard & Poor’s.
Invesco stock trades for a 2019 P/E ratio of 8.6, compared with our fair value estimate of 11. Expansion of the P/E multiple could fuel 5.1% annual returns. In addition to the 6.2% dividend yield and expected EPS growth of 5% per year, annual returns are expected to exceed 16% per year.
#7: AbbVie Inc. (ABBV)
AbbVie appears in both our list of best blue chips, and list of highest yielding blue chips. Click here to see our analysis of AbbVie from earlier in this article.
#6: AT&T Inc. (T)
AT&T appears in both our list of best blue chips, and list of highest yielding blue chips. Click here to see our analysis of AT&T from earlier in this article.
#5: Occidental Petroleum (OXY)
Occidental appears in both our list of best blue chips, and list of highest yielding blue chips. Click here to see our analysis of Occidental from earlier in this article.
#4: Altria Group (MO)
Altria appears in both our list of best blue chips, and list of highest yielding blue chips. Click here to see our analysis of Altria from earlier in this article.
#3: Taubman Centers, Inc. (TCO)
- Dividend History: 10 years of consecutive increases
- Dividend yield: 6.6%
Taubman Centers is a retail REIT that acquires, develops, owns, and operates high-grade malls and shopping centers in the United States (including Puerto Rico), as well as in China and South Korea. Taubman Centers is focused on the upper end of the quality spectrum of U.S. malls and shopping centers. Taubman Centers is trading with a market capitalization of $2.5 billion.
Taubman Centers has a high-quality property portfolio.
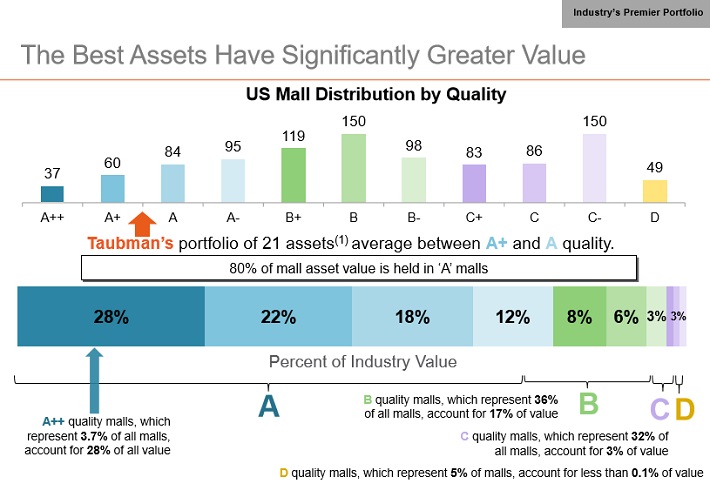
Source: Investor Presentation
Taubman Centers reported its first quarter earnings results on April 30. The company generated revenues of $160 million during the first quarter, which was 0.8% less than the revenues that Taubman Centers was able to generate during the previous year’s quarter. Taubman Centers’ funds from operations totaled $0.95 on a per-share basis during the first quarter, which was 9% less than the funds from operations that the company generated during the first quarter of 2018.
Taubman Centers performed poorly in the first quarter, but the company did make significant operational progress. Taubman Centers’ sales per square foot, occupancy rate, leased space, and average rents were all up compared to the previous year’s quarter, which shows that its high-quality assets are withstanding the Amazon threat. Taubman Centers guides for adjusted funds from operations of $3.62 to $3.74 on a per-share basis during fiscal 2019.
Taubman Centers has one of the highest-quality portfolios among mall REITs. This has allowed for above-average rent growth, and leads to compelling same center net operating income. The company expects that its same-center net operating income will rise by 2% during fiscal 2019.
Another growth catalyst is the company’s malls in China and Korea, where retail sales are growing at a stronger pace than in the U.S. This allows for above-average growth in rents and net operating income. Due to the fact that there is not a lot of retail space in these countries, Taubman Centers has the potential to grow its asset base in China and Korea further.
We believe Taubman’s dividend is secure, as the company has a projected FFO payout ratio of 73.4% for 2019.
#2: Omega Healthcare Investors (OHI)
- Dividend History: 16 years of consecutive increases
- Dividend yield: 7.2%
Omega Healthcare Investors is a Real Estate Investment Trust with a focus on healthcare properties. Omega Healthcare Investors (OHI) is a healthcare REIT that generates over 80% of its revenues from its skilled nursing facilities, and the remainder of its revenues from senior housing developments. Omega has a market capitalization of nearly $8 billion.
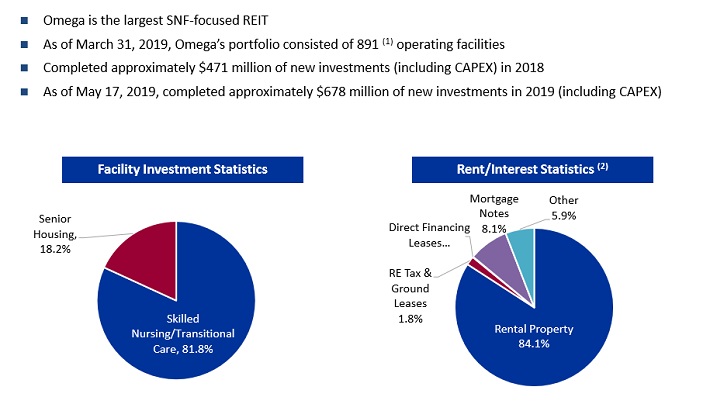
Source: Investor Presentation
Omega reported first-quarter earnings on 5/7/19 and results were largely in line with expectations. Total revenue came in at $223.7 million in Q1, a fractional increase year-over-year.
Omega has grappled with two bankruptcies among its tenants in recent quarters, and it continues to refer to the environment for its operators as challenging. This has kept a lid on outright growth but importantly, Omega is retaining its profitability.
Funds-from-operations, or FFO, came in at $144.1 million, or $0.67 per share, a ~6% decline from the $0.71 in FFO earned in last year’s Q1. On a dollar basis, FFO declined just over 2%, but Omega’s share count rose from 208 million to 214 million year-over-year. On an adjusted basis, FFO per share was $0.76 compared with $0.78 in the year ago period, excluding non-cash and non-operational expense items present in Q1.
Omega also announced its MedEquities acquisition is progressing and should close in the coming months. Further, the trust said it resolved the sale and transition of legacy Orianna assets, a former tenant that entered bankruptcy last year. Finally, the trust said a different operator, Daybreak, sought and received near-term liquidity relief of $2.5 million in rent deferral for the first two quarters of the year. The number of tenants Omega is seeing experiencing significant financial woes is troubling, but the damage thus far is fairly limited.
Omega’s dividend appears to be secure, as the company should enjoy favorable long-term industry dynamics. Omega benefits from some favorable secular trends. The number of elderly people in need of healthcare is expected to grow at a fast pace over the next decade. In addition, the trend is for increasing healthcare spending in the U.S. Omega will see only a small portion of its leases expire over the next decade. Moreover, it has no material debt maturities until 2022. Therefore, the REIT is likely to enjoy reliable free cash flows in the upcoming years, without any shocks from debt maturities. We expect the REIT to grow its FFO at a 4.5% average annual rate over the next five years.
This growth will help secure the company’s hefty dividends. Omega’s dividend payout for 2019 is fairly high at 86%, but the dividend appears sustainable as long as the company’s turnaround stays on track.
#1: Tanger Factory Outlets (SKT)
- Dividend History: 26 years of consecutive increases
- Dividend yield: 8.7%
Tanger Factory Outlet Centers is a Real Estate Investment Trust. Tanger operates, owns, or has an ownership stake in a portfolio of 40 shopping centers. Properties are located in Canada and 20 U.S. states, totaling approximately 14.4 million square feet, leased to over 500 different tenants. Tanger has enjoyed sustained high portfolio occupancy for many years.
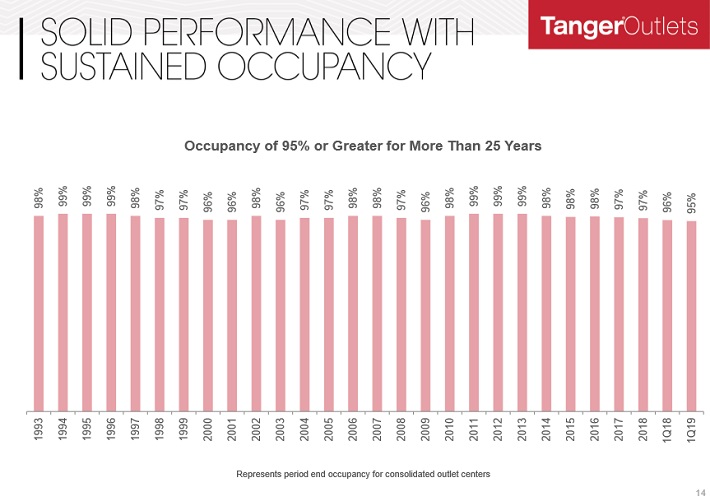
Source: Earnings Slides
Tanger reported a 5% decline in funds from operation (FFO) in the 2019 first-quarter. Although Tanger maintained its high portfolio occupancy at 95.4% in the first quarter, this was still a year-over-year decline from 95.9% in the same quarter in 2018. Net operating income (NOI) for the consolidated portfolio declined 0.5% for the quarter. The company also sold four noncore outlet centers for total gross proceeds of $130.5 million during the quarter.
Occupancy is expected to decline somewhat in 2019 to a range of 94.0% to 94.5%, due to anticipated store closures by certain tenants. Fortunately, the company has maintained an occupancy rate of 95%+ for 25 consecutive years.
The dip in occupancy this year will negatively impact the company’s AFFO, but Tanger will still be able to cover its hefty dividend payment.
Tanger has a current dividend payout of $1.42 per share annually, which represents a current yield of 8.7%. This is a very high yield and is clearly attractive for income investors. Tanger appears to have a secure dividend payout.
The company is expected to generate AFFO-per-share of $2.25 for 2019. With an expected dividend payout of $1.47 per share, Tanger’s expected 2019 dividend payout ratio is 65%. This is a manageable payout ratio, which leaves room for modest annual hikes. For example, in February Tanger raised its dividend by 1.4%.
Tanger stock trades for a P/FFO ratio of 7.3, significantly below our fair value estimate of 12. Expansion of the P/FFO ratio could fuel annual returns above 23% per year over the next five years.