

A Correction is Obviously Coming; Which is Why It Hasn’t Got Here Yet


We have consistently maintained that the stock market is in a long-term bull market and that the probability of a recession starting in the next twelve months is low. At the same time, we have been suggesting that a correction of between 3% and 5% is highly probable. To date, we have been proven correct on the former, but we have failed with the latter. This hyper-active market refuses to go down for a nap.
Part of the problem seems to be the elevated amount of fear and expectation of a market correction that is permeating through the retail (and to some extent the professional) investing community. The old market adage, ‘if it’s obvious, it’s obviously wrong’ is applicable at the moment. The AAII bullish sentiment took a nose-dive this week and the NAAIM index continues to roll-over (see below under Sentiment). A correction will happen, but not while the majority are expecting it.
Equities
Sentiment
The AAII bull sentiment collapsed this week from a relatively high 45%, down to 29%, while the bearish sentiment spiked up 12% to 35%. This could be a new ‘counter-trend’ pattern forming, since the market has been on a tear, yet bull sentiment has dropped, or it may be fuel for the market to continue climbing a ‘wall of worry’. Major tops don’t happen when there is this much fear, but a correction is not out of the question. The chart below, gives a long-term view of sentiment and tops.
{This section is for paid subscribers only. Join us at www.angtraders.com}

{This section is for paid subscribers only. Join us at www.angtraders.com}
Technical
Nine out of the last ten times that the volatility index (VIX) has made a down-spike, the SPX has corrected. The VIX could still be in the process of making a down-spike. This increases the likely-hood of a correction in the SPX (chart below).

{This section is for paid subscribers only. Join us at www.angtraders.com}
The long-term technical averages continue to demonstrate a late-stage bull market and no warning signs are evident. The 8-month moving average falling below the 12-month moving average, would be a long-term bear signal. The cyclical bull market is still in place (chart below).

{This section is for paid subscribers only. Join us at www.angtraders.com}
Fundamental
Bull markets are supported by increasing industrial production, and increasing GAAP earnings, both of which continue to strengthen. And contrary to popular belief, bull markets are accompanied by increasing Fed funds rates. Only when the Fed increases rates too far, too fast, is a recession triggered. We are still in a sweet spot, fundamentally speaking (chart below).

The important 10-year minus 2-year rate differential remains comfortably in positive territory despite having moved lower this week, and its slope points to a another 12-to-18-months before the probability of a recession becomes significant (chart below).

Our Price Modelling system continues negative on the daily scale; has turned negative on the weekly scale; and remains positive on the monthly scale. We continue to expect a correction in the near-term, while being bullish in the long-term.
Oil
{This section is for paid subscribers only. Join us at www.angtraders.com}
Gold
{This section is for paid subscribers only. Join us at www.angtraders.com}
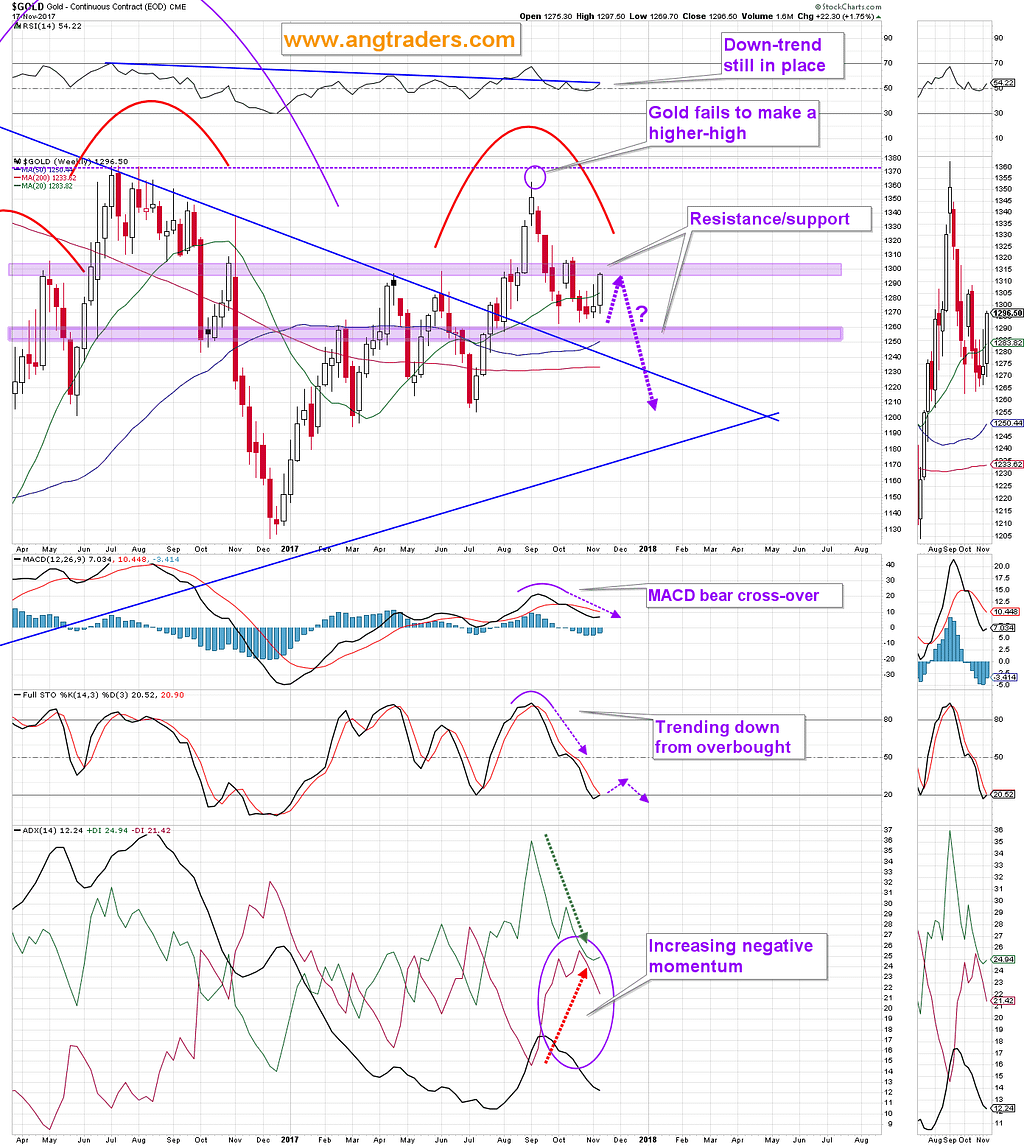
Technically, gold was a little over-extended in the stochastic, but the MACD and the RSI still have room to the downside. If gold closes above $1310, then it could make another attempt at a new high above $1370.
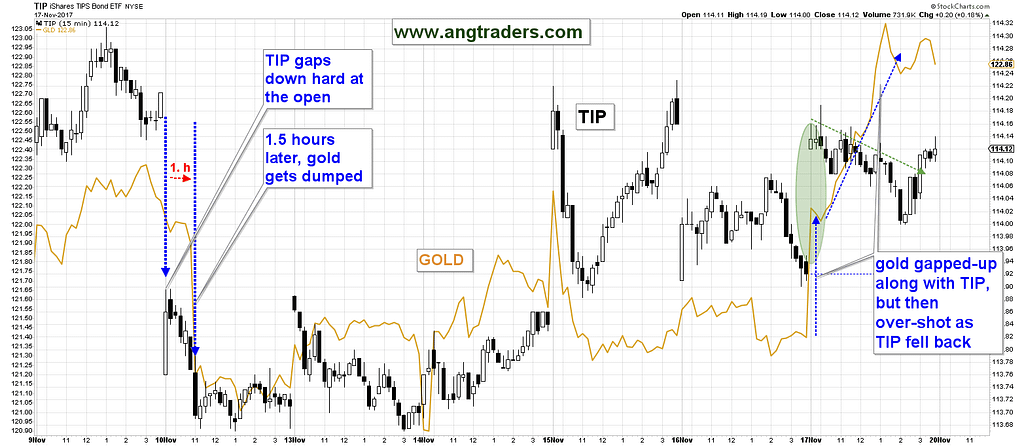
Gold seems to have over-shot, relative to TIP. Gold gapped-up at the open in response to TIP, but then continued to rise even as TIP fell back. This makes it vulnerable over the next day or two.
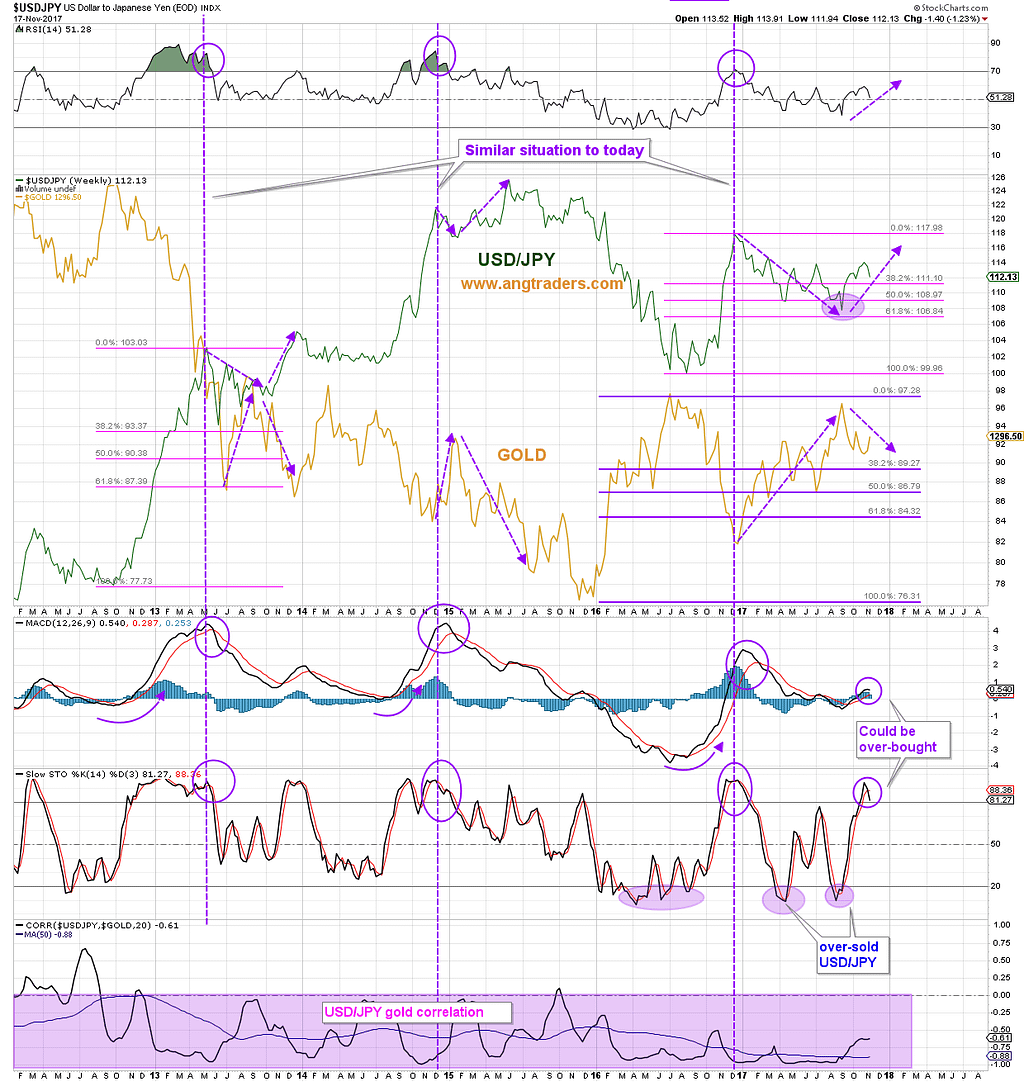
The USD/JPY may be getting over-bought, although since the MACD has not crossed-over, it may only be a temporary hold-up. The pair could resume the rally soon and put pressure on gold.
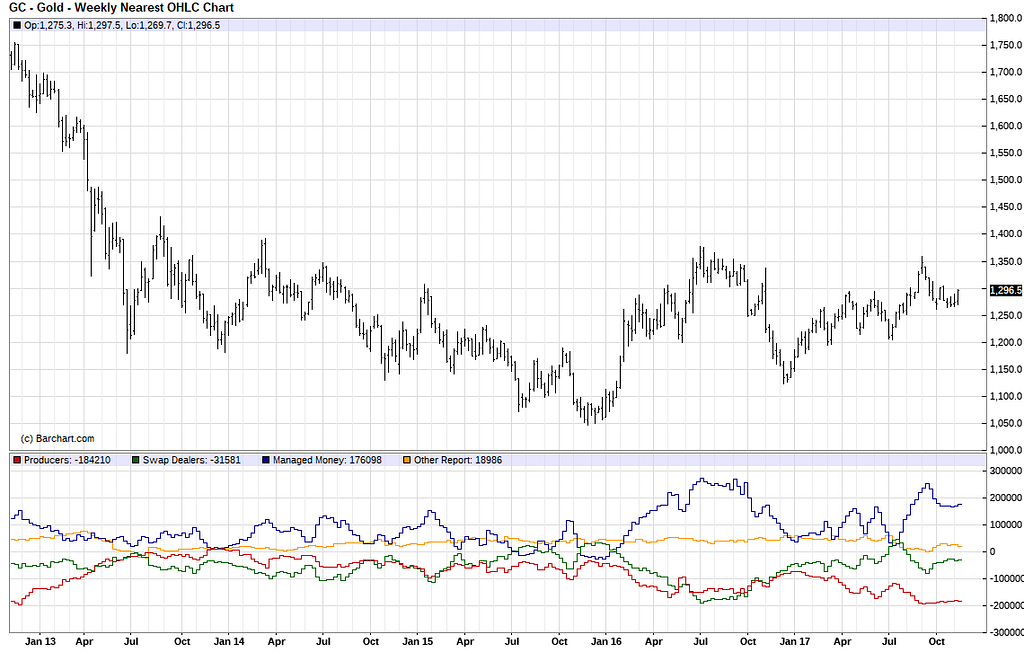
The commitments of futures trades have remained essentially static since the beginning of October which indicates that gold could continue to trade within a range in the near future (chart below).
{This section is for paid subscribers only. Join us at www.angtraders.com}
We wish our subscribers a profitable week ahead and ask that email be monitored for Trade Alerts and Updates.
ANG Traders
Source: Nicholas Gomez