

Copper Changes Its Tune


Two weeks ago, we pointed out how the copper price and the Shanghai stock index had moved lower following the end of the National Congress of the Communist Party of China (NPC) (chart below, Dec. 9/17).

We also pointed out that “Falling copper and falling Chinese equity prices are incongruent with the prevailing narrative of global growth expectations that have been underpinning stock prices”, and we displayed the divergence between the Shanghai index and the SPX (chart below, Dec. 9/17).

We speculated that the drop in copper prices might only be temporary and that a recovery in copper could allow Chinese stocks to rejoin the SPX in its “relentless ascent”. It turns out that copper has in deed recovered, but the Shanghai index has remained flat (chart below).
This, of course, while the SPX continues to defy gravity (chart below).

Chinese stocks are more volatile and we could certainly see them get back in line with both copper and the SPX, but it raises some caution flags; the SPX may pull back if Chinese stocks fail to make a recovery soon. It is possible that copper and the SPX have got ahead of themselves.
Equities
Sentiment
{This section is for paid subscribers only}
The NAAIM index 50 MA continues to roll-over while the SPX charges higher. This negative correlation is similar to what preceded the 2015 double-dip correction. The fact that the market has refused to correct a healthy 3–5%, could mean that in the near future (next two weeks?) the correlation will revert to the mean with a more substantial 10–15% correction in the S&P 500, like it did in 2015 (chart below).

{This section is for paid subscribers only}
The RYDEX bear:bull asset allocation ratio continues in a long-term bullish pattern. A major top does not look likely until the second half of 2018, but a shorter-term correction is over-due (chart below).

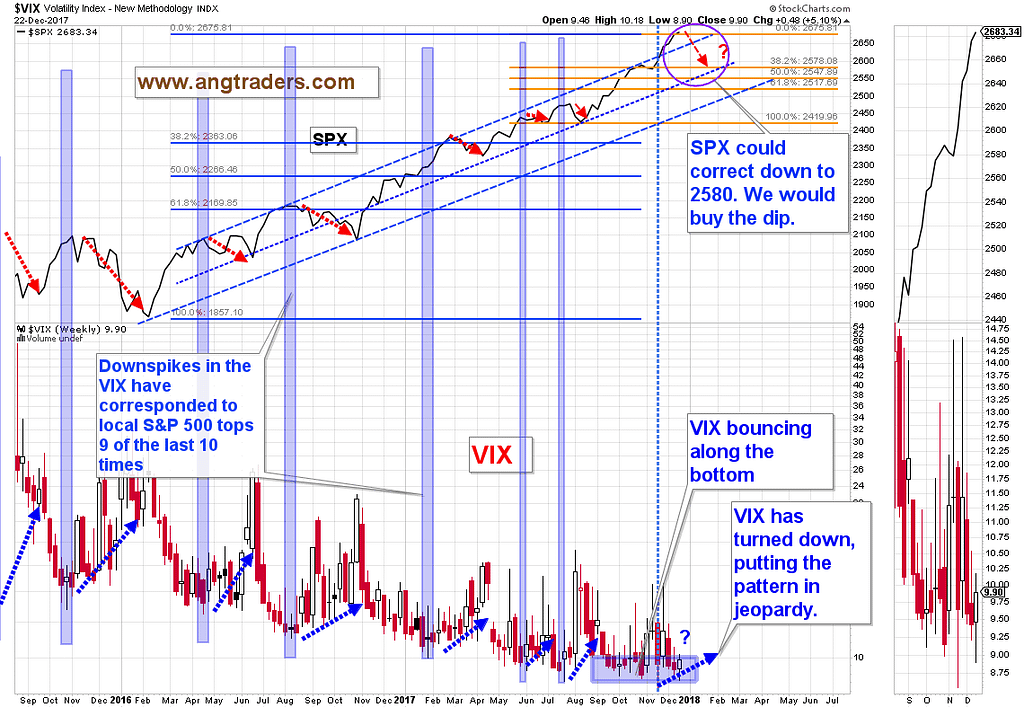
The VIX volatility index closed higher this week keeping the pattern in play. A continuation of this (rising VIX) increases the probability of a near-term correction. This fits with our present view that a correction is likely in the next two weeks (chart below).
{This section is for paid subscribers only}
Technical
The long-term technical averages continue to demonstrate a late-stage bull market and no warning signs are evident. The 8-month moving average falling below the 12-month moving average, would be a long-term bear signal. The ADX trend still has room to move up before it bumps up against the down-sloping major trend (blue dashed line on chart below). This long-term strength does not preclude the correction that we are expecting.

{This section is for paid subscribers only}
Fundamentals
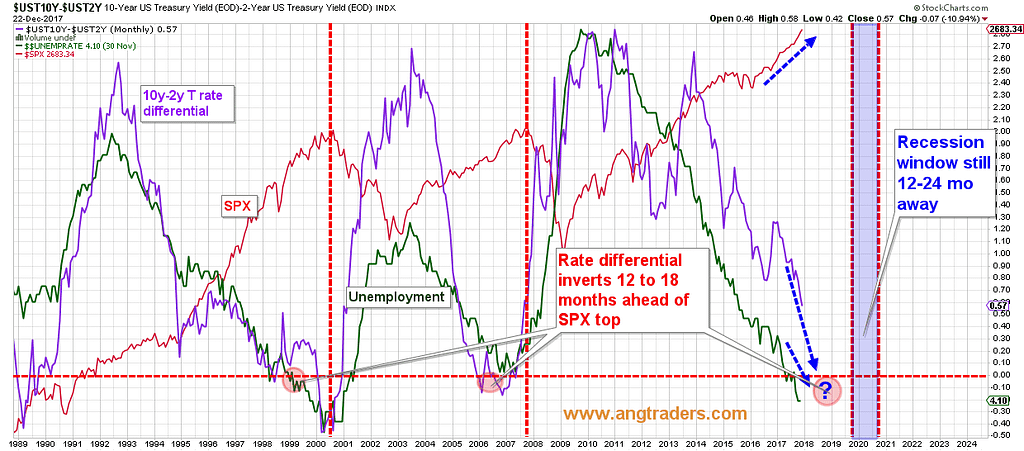
The 10-year minus 2-year rate differential rose slightly this week from 0.51 to 0.59, but its slope continues to predict a median of 18-months before the probability of a recession becomes significant (chart below).
{This section is for paid subscribers only}
OIL
{This section is for paid subscribers only}
Gold
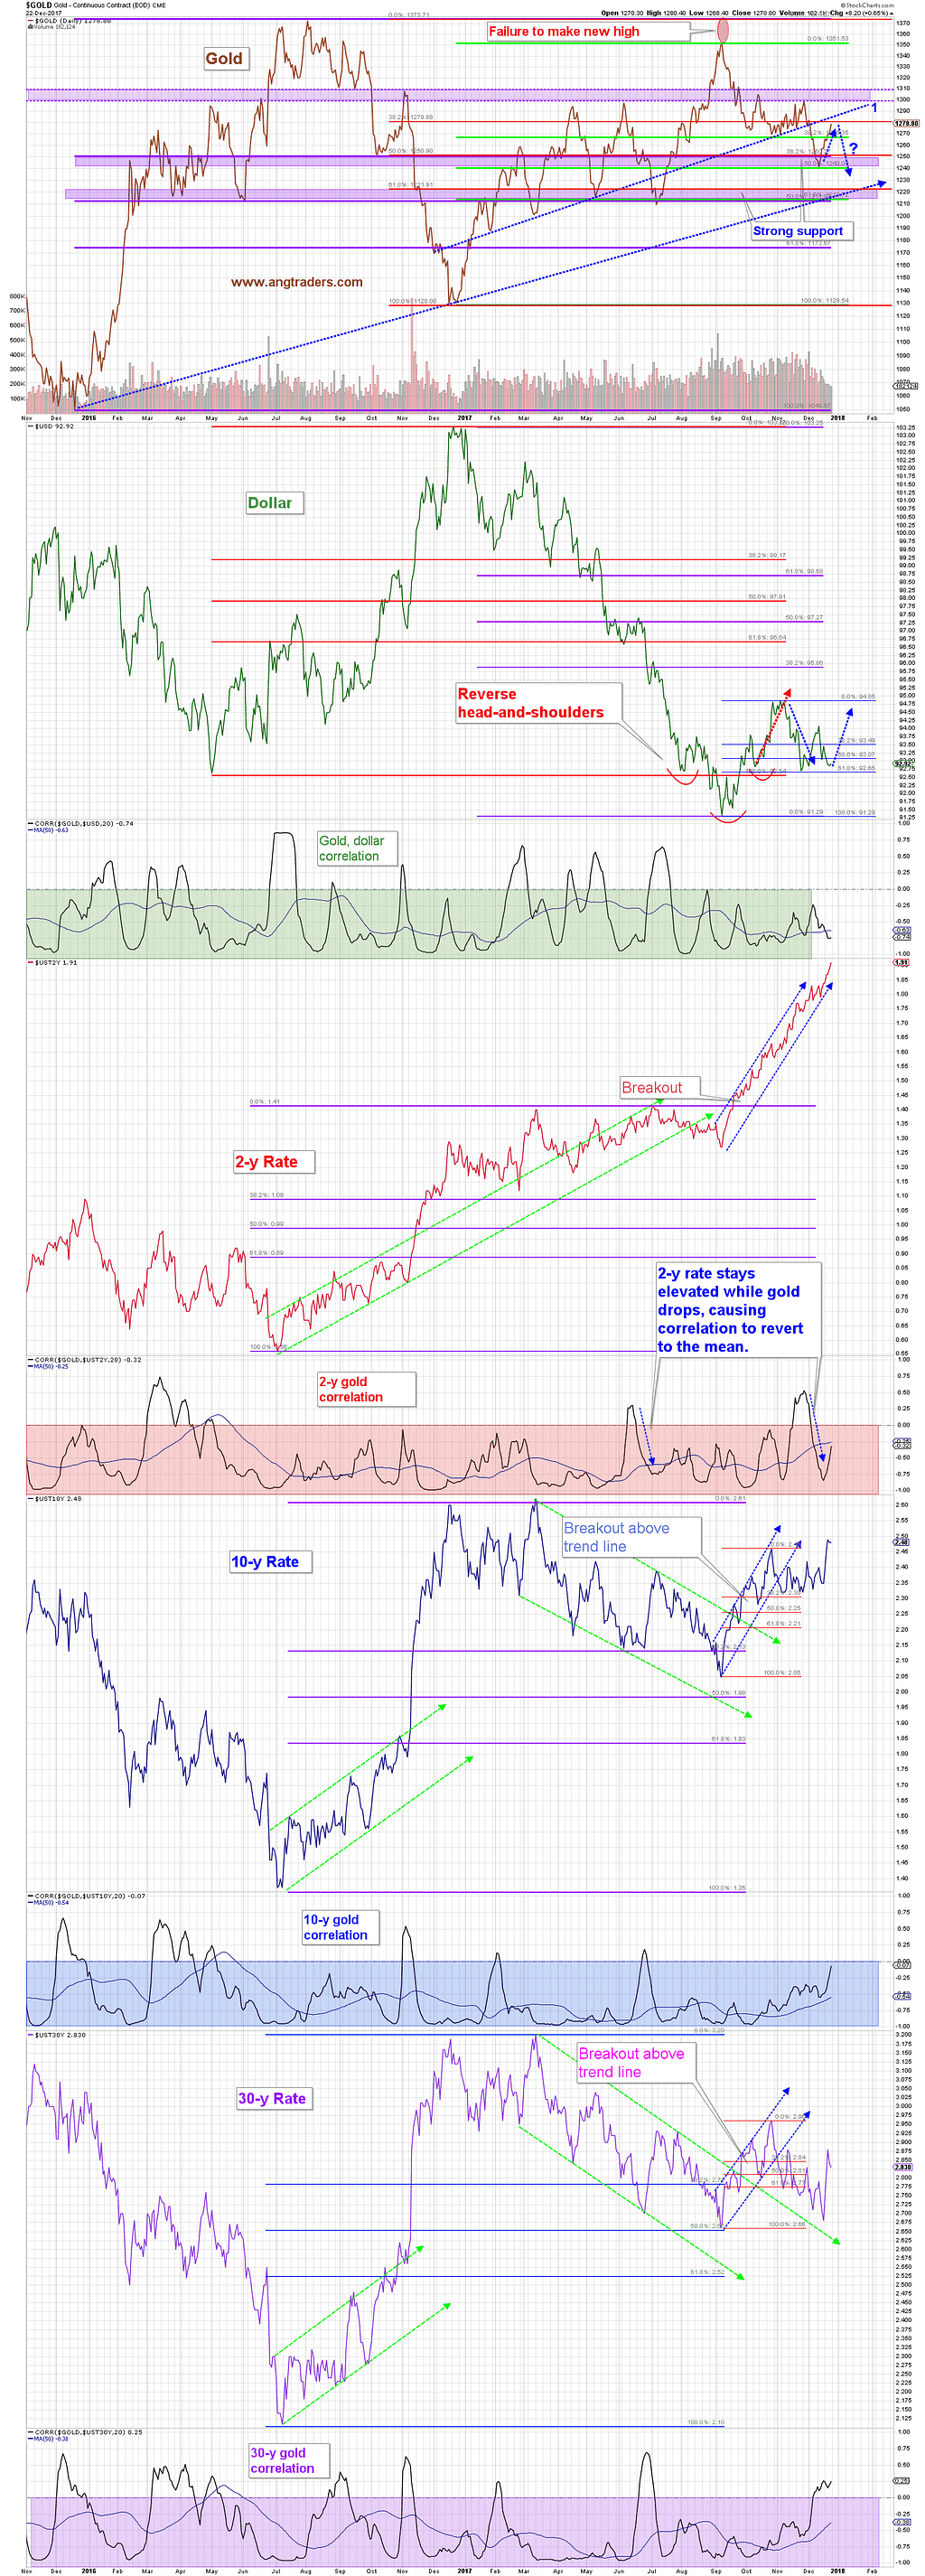
For two weeks now, we have been saying that gold was likely to bounce from its $1240 support zone up to $1265. This past week, gold made it all the way to $1278 which is just shy of the $1280 resistance of the 38% Fibonacci retrace of the entire 2017 rally. This resistance level is also close to the upper trend-line labeled 1 in the chart below. With all parts of the rate curve moving higher, and with the dollar close to support at 92.65, there is a fair chance that gold has limited upside at this point (chart below).
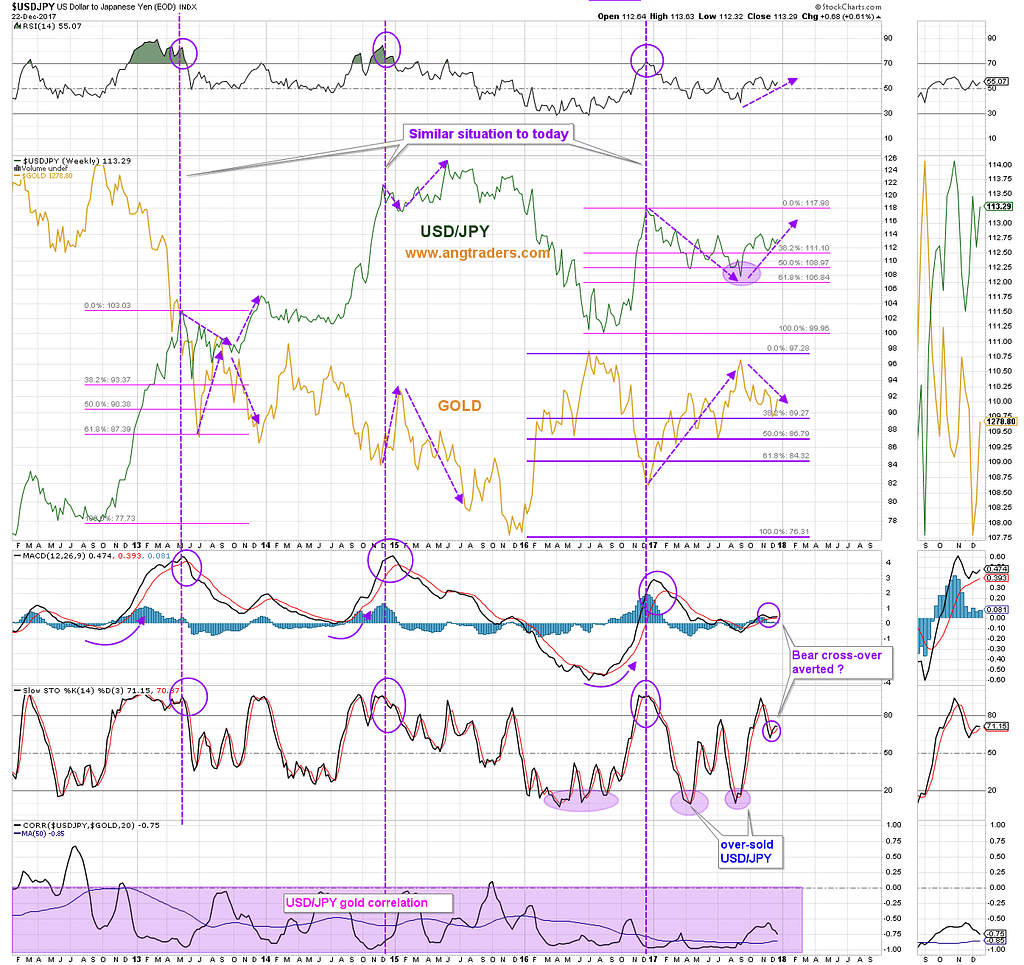
The USD/JPY FOREX ratio continues its bounce off of the 38% Fibonacci retrace. The uptrend in the ratio continues at this point (chart below).
{This section is for paid subscribers only}
After two weeks of bullish moves in the net open interest of gold futures traders — reduction of shorts by producers and swap dealers, and reduction of longs by speculators — the positions have started to reverse in the bearish direction; producer positions were essentially unchanged, while swap dealers reduced their long positions from 12k to 2k contracts, and the speculators increased their longs from 76k to 81k contracts. Not a strong move, but a move that may limit gold’s upside (chart below).

{This section is for paid subscribers only}
Source: Nicholas Gomez