

The 35-Year, and 35-Thousand Foot View of the Situation


Since it is the end of the year, we thought it would be appropriate to step back and take a super-wide view of the markets.
Looking back 35-years or so, it becomes obvious that stocks have been trending upward and bond yields have been trending downward. This demonstrates that money has been steadily flowing into both stocks and bonds for nearly four decades (chart below).

There have been two serious corrections (crashes) in stocks which caused money to seek safe harbor in bonds which reduced the yield on the 10-year bonds (chart below).

This time around, unless bond yields rise significantly above their current historically low level, there is danger of a cross-asset collapse where both stocks and bonds fall in price at the same time. This “perfect storm” scenario would mark the end of the “bond bubble” and make the bursting of the Tech and housing bubbles look tame by comparison. There would be nowhere to hide. That is the major reason why the Fed is trying to push rates higher and reduce its balance sheet even though the inflation mandate has yet to be achieved; they need rate-cut and QE ammunition for when the inevitable downturn develops.
This coming year is starting with the business cycle experiencing healthy growth as measured by earnings, manufacturing activity, housing permits, financial health, and consumer confidence, so we don’t think this cross-asset crash is likely to occur in 2018. We expect two things to happen in the lead-up to the next recession; the 10-year minus 2-year bond yields will invert, and a general consensus will develop that Central Banks’ actions from around the world have made things “different this time”. Confidence will be running feverishly high before the bubble bursts. We hope that by the time the next down-turn does come along, the Fed will have raised rates, and reduced its balance sheet sufficiently to soften the crash.
In the meantime, we expect a correction will develop early in the year — perhaps as early as next week. Two weeks in a row of 50%+ bull sentiment readings from the AAII survey makes a 5% — 10% correction increasingly likely.
Equities
Sentiment
For the second week in a row, the AAII bull sentiment is above 50% (52.6%), and the bear sentiment is below 30% (20.6%). Even though these levels are necessary for minor and major market tops to develop, they are not sufficient. They do not guarantee a correction, but these levels certainly increase the odds of one (2 charts below).

{This section is for paid subscribers only}
The NAAIM index 50 MA continues to roll-over while the SPX charges higher. This negative correlation is similar to what preceded the 2015 double-dip correction. The fact that the market has refused to correct a healthy 3–5%, could mean that in the near future (next week ?) the correlation will revert to the mean with a more substantial 10–15% correction in the S&P 500, like it did in 2015 (chart below).

{This section is for paid subscribers only}
The VIX has turned up again which reinforces the pattern (blue arrows) that leads to corrections 90% of the time (chart below).

{This section is for paid subscribers only}
Technical
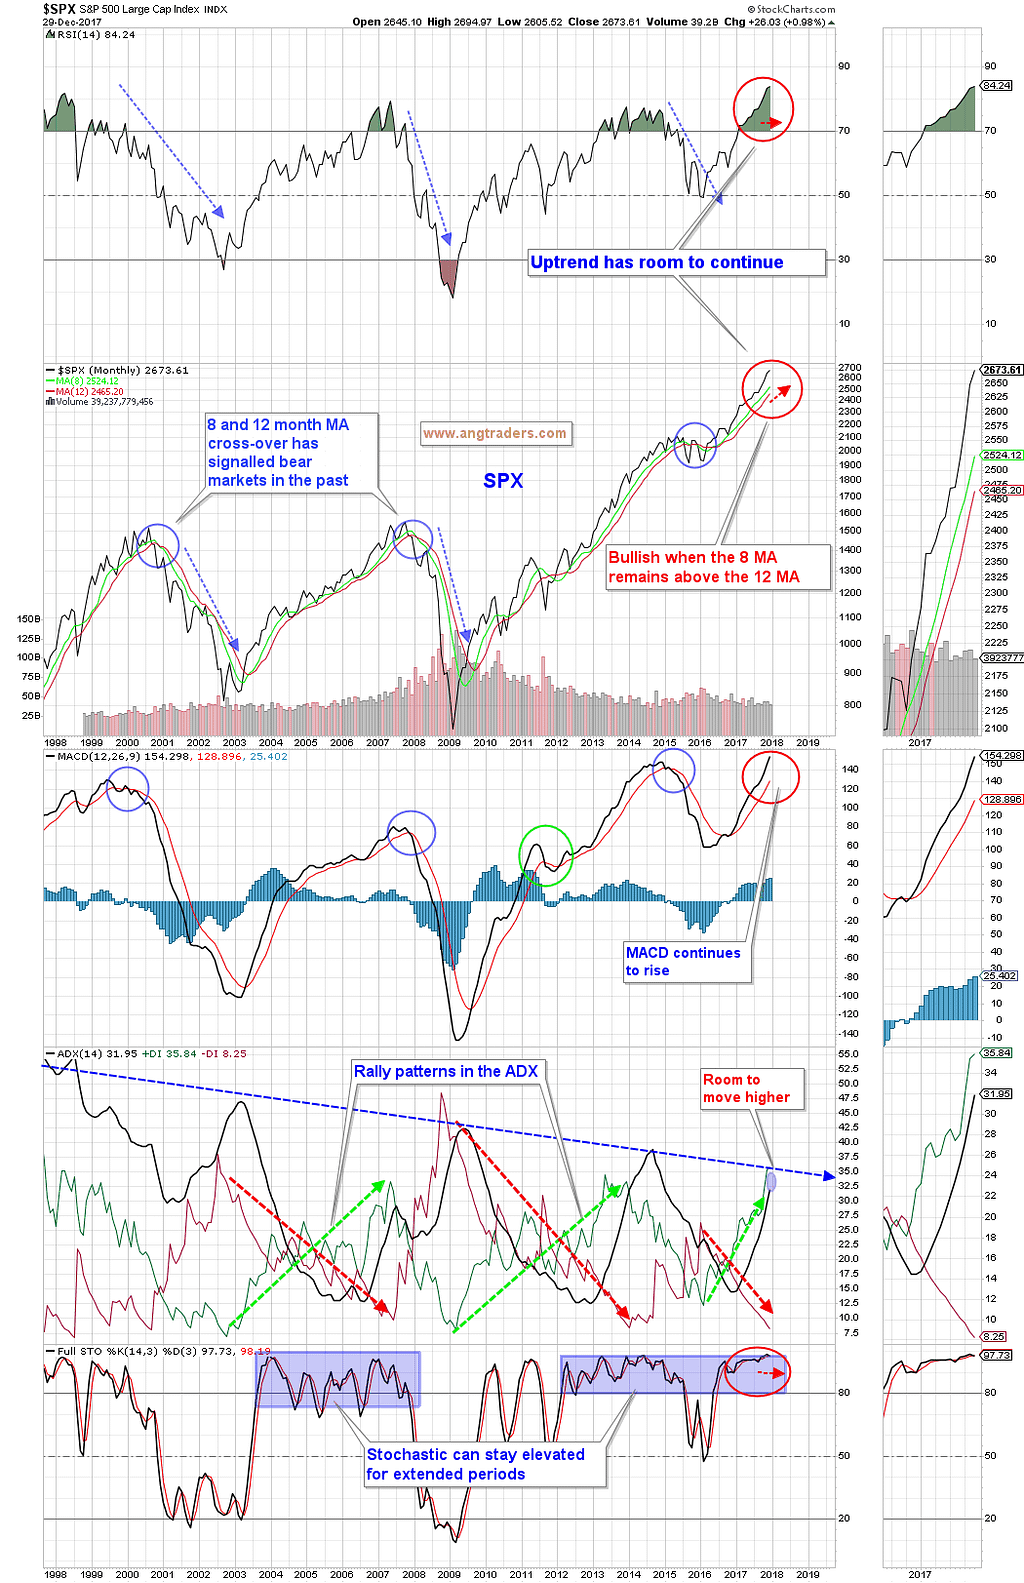
The long-term technical averages continue to demonstrate a late-stage bull market and no warning signs are evident. The 8-month moving average falling below the 12-month moving average, would be a long-term bear signal. The ADX trend still has room to move up before it bumps up against the down-sloping major trend (blue dashed line on chart below). This long-term strength does not preclude the correction that we are expecting.
{This section is for paid subscribers only}
Fundamentals
The 10-y minus 2-y differential dropped down to 0.51 (where it was two weeks ago). If it maintains this slope, the curve will invert in the second half of 2018 and imply a recession to start in 2019. No flags at this time scale.
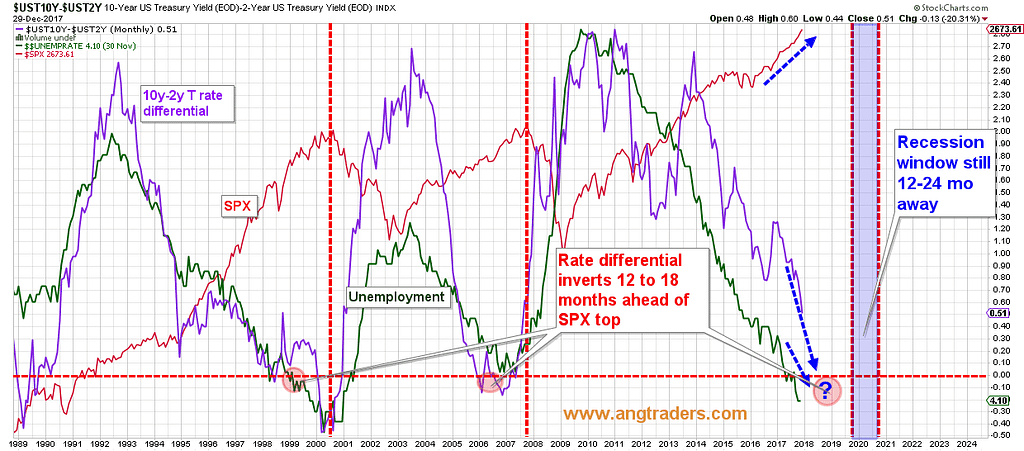
Fundamentally, we are still in a secular bull market where interest rates, GAAP earnings (a new high) and industrial production are rising, while the unemployment rate is falling. It is notable that the Fed funds rate has displayed a declining topping pattern over the last 35-years (pink trend line on chart below). Accordingly, it looks like this hiking cycle could max-out around the 2.0% level for the Fed funds rate late in 2018, which would align with the timing of the next recession derived from the 10-y minus 2-y chart. (chart below)

Our Price Modelling System is short-term negative; medium-term negative/neutral; and long-term positive. We are looking to increase our short equities position this coming week.
Oil
{This section is for paid subscribers only}
Gold
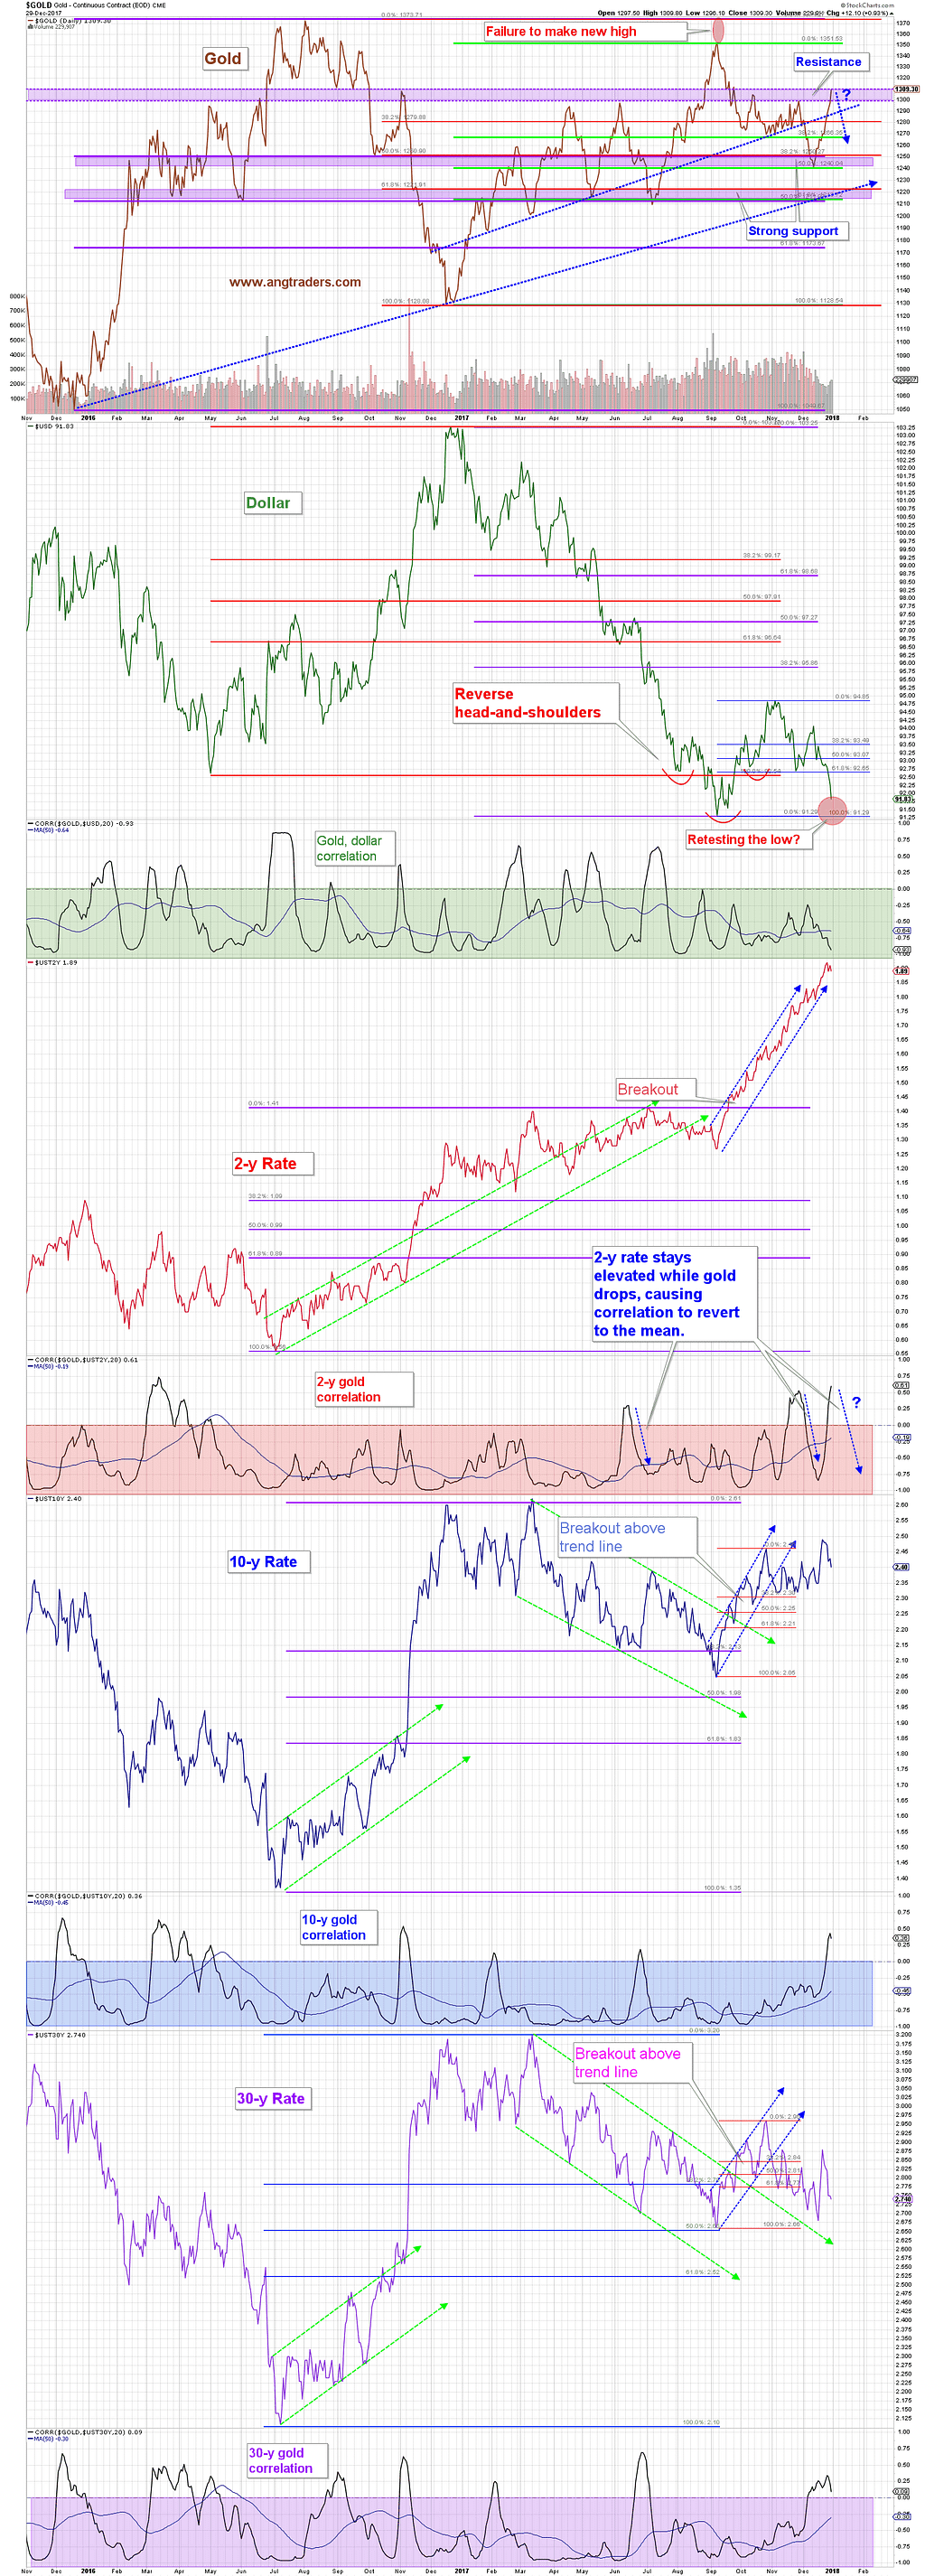
Gold rallied strongly last week in response to a collapsing dollar, which looks set to retest the recent 91.30 low. Gold is at strong resistance ($1310) and if the dollar bounces off its low, gold will drop back in response. If the dollar continues to drop into new lows, then gold has no resistance until $1350. (chart below)
{This section is for paid subscribers only}
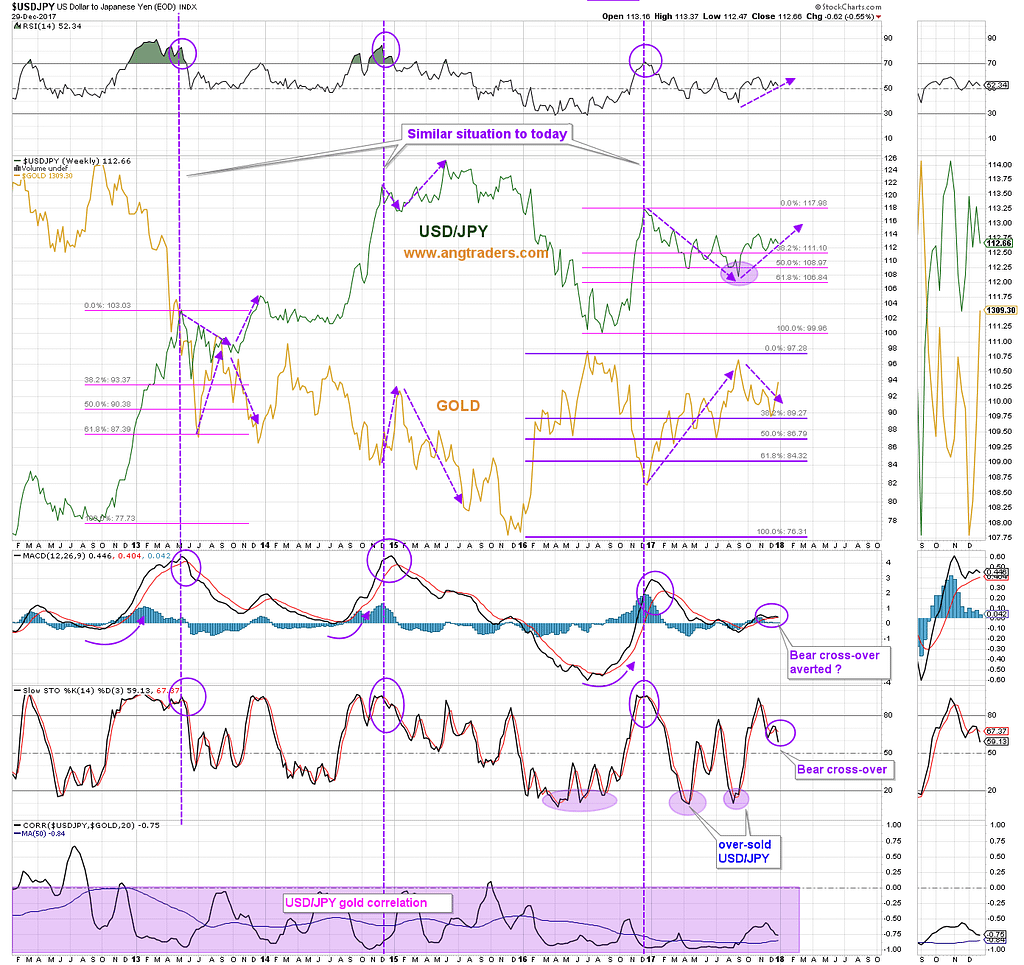
Despite the collapse in the dollar, the USD/JPY FOREX ratio has held its uptrend. As long as it stays above the 38% Fibonacci retrace level of 111, the price of gold will be limited. (chart below)
{This section is for paid subscribers only}
The commitments of futures traders, continues to turn bearish on gold; producers increased their net shorts by 10k to 141k contracts, swap dealers went from being long 2.6k contracts to short 7.9k contracts, and the speculators increased their net long position from 81k to 107k contracts. This is a bearish indication for gold, but the nominal levels of commitment are not yet high enough to cause gold to drop in the short term (chart below).

{This section is for paid subscribers only}
Regards,
ANG Traders
Join us at www.angtraders.com and replicate our trades and profits.
Source: Nicholas Gomez