


Updated on July 23rd, 2019 by Bob Ciura
In general, the energy sector is highly regarded among income investors for their high dividends. This makes the sector a favorite of income investors looking for potential high yield investments.
You can download your full list of all 300+ securities with 5%+ yields below to save for future reference.
While the price of oil remained suppressed for three years from 2014-2016, many large-cap energy stocks are back on stronger footing.
The supply glut of oil has been eliminated in recent years and investment cuts by most large producers in future years will continue take their toll on the global supply. The price of oil is likely to remain supported for the foreseeable future because of this.
Nevertheless, as some stocks have already priced most of the expected earnings growth of the upcoming years, investors should be particularly careful in their choices.
Table of Contents
The terms “Big Oil” and “super-majors” are interchangable, and refer to the 6 largest oil companies that aren’t state owned. The 6 Big Oil supermajors are:
In this article, we will rank the six oil supermajors from best to worst, based on their expected 5-year returns. We calculate expected returns based on the combination of valuation changes, expected earnings growth, and dividend yields.
Supermajor Big Oil Stock #1: Royal Dutch Shell (RDS.A, RDS.B)
- Expected Returns: 14.8%
Royal Dutch Shell is an oil and gas supermajor. It is the second-largest behind Exxon Mobil in terms of annual production volumes. Shell is currently valued at $254 billion, also ranking second among oil companies behind Exxon Mobil.
Shell is headquartered in London U.K. as well as in the Netherlands. There are two types of shares: RDS.A shares, listed in the Netherlands, and RDS.B shares, listed in the United Kingdom.
Royal Dutch Shell operates in three segments: upstream, downstream, and integrated gas. The company struggled during the 2014-2016 downturn of the oil market, with its EPS plunging 87% from $4.72 in 2014 to $0.60 in 2015. Its upstream segment is highly leveraged to the price of oil and was the reason for the precipitous EPS decline.
Royal Dutch Shell reported its 2019 first quarter earnings results on May 2. The company reported revenues of $84 billion for the first quarter, which was 6.2% lower than the previous year’s first quarter. This decline can be primarily attributed to lower oil prices compared to the previous year.
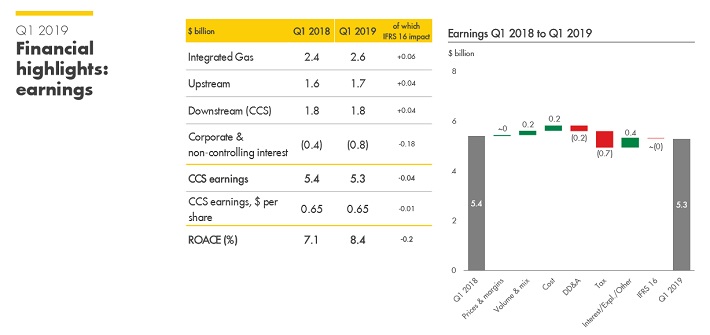
Source: Earnings Slides
Lower realized oil prices were a headwind for Shell during the first quarter, but the company benefited from higher trading profits and improved LNG sales. This is why Shell managed to generate net profits of $5.4 billion, down only 2% year over year, despite the larger-than-expected revenue decline.
Shell generated earnings-per-share of $1.30 during the first quarter, unchanged from the prior year’s period, as a lower share count offset the net profit decline. Shell continued to produce highly compelling cash flows during the first quarter, as operating cash flows totaled $11.3 billion during Q1, up from $10.4 billion year-over-year.
In addition, Shell management recently stated that it would increase its capital expenses to $25 billion to $30 billion per year through 2020.
We expect Shell to generate EPS of $5.53 in 2019, meaning the stock has a P/E ratio of 11.6. Our fair value estimate is a P/E ratio of 12, meaning Shell is only slightly undervalued right now. Expansion of the P/E ratio could fuel 0.7% annual returns.
In addition, the dividend yield of 5.9% and expected EPS growth of ~8.2% per year results in total expected returns of 14.8% per year through 2024.
Supermajor Big Oil Stock #2: Total (TOT)
- Expected Returns: 13.5%
Total is the fourth-largest oil and gas company in the world based on its market capitalization of $141 billion. Like the other oil and gas super majors, it is a fully integrated company. Total operates in four segments: upstream, downstream (mostly refining), marketing & gas, and renewables & power.
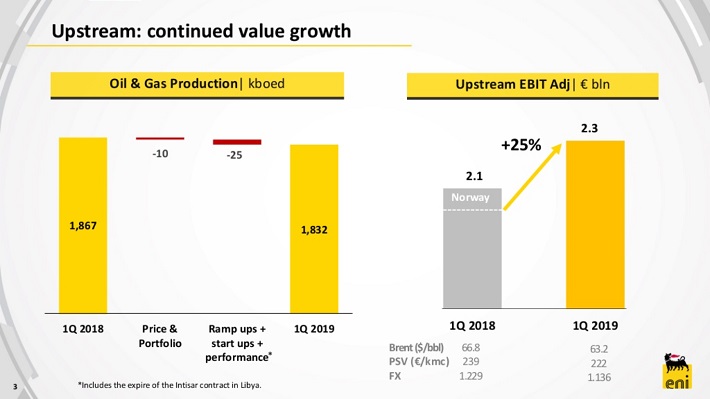
In late April, Total reported (4/26/19) financial results for the first quarter of fiscal 2019. Thanks to the ramp-up of major growth projects, the company grew its production by 9% over last year’s first quarter. Production grew from 2.70 to 2.95 million barrels per day. However, the average prices of Brent and natural gas were 6% and 2% lower, respectively. As a result, Total’s net earnings fell 4% over last year. Due to continuing strong contribution from start-ups and ramp-ups, management expects output growth to exceed 9% this year. This is by far the highest production growth rate among the oil majors.
Total exhibited much better performance than its peers during the 3-year downturn of the oil market from 2014-2016. During this period, in which the oil price plunged up to 70%, Total’s EPS fell only 49%. Contrast this result with Exxon Mobil, whose EPS plunged 75% and Royal Dutch Shell which posted an EPS decline of 87%. Meanwhile, Chevron and BP recorded losses in 2016.
The key factor behind Total’s resilience was its superior refining segment. During the rough years of refining (2008-2013), the upstream segment was generating about 90% of total earnings of all the oil majors. Consequently, the other oil majors sold many of their refineries during that period, failing to see that their refining segment was their hedge against a potential plunge of the oil price. Total maintained almost all its refineries and hence it has reaped the full benefit from the high refining margins that have prevailed in the last four years.
The company has returned to a solid growth trajectory. It grew its output by 8% last year and expects to grow output by more than 9% this year. Moreover, it expects to continue to grow output by 5% per year for at least the next three years.
Thanks to strong production growth and our expectations for somewhat higher oil prices in the upcoming years, we expect Total to grow its earnings-per-share by at least 7.0% per year.

Source: Investor Presentation
Given a 5% annual growth in its output and at least a 2% annual rise in the oil price, Total is likely to grow its EPS by at least 7% per year. This is without taking into account its leverage to oil prices, which would boost its results even further if oil prices rally from here.
The stock is currently trading at a P/E ratio of 10.5, which is lower than its 10-year average of 11.9. Total has historically traded for a price-to-earnings ratio of 10 or lower during periods of high oil prices. We believe that the 10-year average price-to-earnings ratio is a reasonable approximation of fair value for Total. If the stock reverts to its fair valuation within the next five years, it will see a 2.5% annualized gain thanks to valuation expansion.
In addition, Total has an expected annual dividend payout of US$3.10 per share for 2019, resulting in an after-tax yield of 4.0% (France has a withholding tax of 30% for U.S. investors). The combination of valuation changes, dividends, and expected earnings growth of 7% per year result in total expected returns of 13.5% per year through 2024.
Supermajor Big Oil Stock #3: BP (BP)
- Expected Returns: 12.7%
BP is one of the largest oil and gas corporations in the world based on its $132 billion market cap. It is a fully integrated company and operates in two segments: upstream and downstream (mostly refining).
BP has gone through extreme challenges since its Gulf of Mexico spill in 2010. It has paid $65 billion for this accident so far, an amount that is almost equal to its entire earnings since. Even in 2018, eight years after the accident, BP paid $3.2 billion (25% of its earnings) in penalties. The company expects to pay another $2.0 billion this year.
However, the worst is behind BP. It has greatly improved its portfolio through the addition of low-cost reserves and has markedly increased its production in recent years. In late April, BP reported (4/30/19) financial results for the first quarter of fiscal 2019. BP’s earnings fell from $3.5 billion in the previous quarter to $2.4 billion. The average price of Brent fell from $69 per barrel in the previous quarter to $63 per barrel, while the average price of Henry Hub natural gas dropped from $3.70 to $3.20.
As a result, the operating profit of BP’s upstream segment fell 26%. In addition, the downstream segment was affected by much lower refining margins worldwide, the collapse of the discount of North American heavy crude oil to WTI, and lower marketing earnings. All these headwinds more than offset the improved results of supply and trading.
Still, BP generated more than enough cash to invest in organic capex, and pay its dividend to shareholders.

Source: Investor Presentation
Moreover, BP drastically reduced its operating expenses in the recent downturn and now invests only in projects that are profitable even below $40 per barrel. As a result, the oil major has reduced its breakeven point to $50 and expects to further reduce it to $35-$40 per barrel by 2021.
As BP is likely to grow its output by about 5% per year in the upcoming years and the price of oil is likely to remain at least steady, the oil major is likely to grow its EPS by at least 5.0% per year over the next five years. BP stock also appears to be slightly undervalued today. The stock is currently trading at a P/E of 11.2, which is below our fair value estimate of 12.0.
Consequently, if its valuation reverts to its average level in the next five years, the stock will see a 1.4% annualized boost to its annual returns. BP stock has a 6.3% dividend yield, leading to total expected returns of 12.7% per year through 2024.
Supermajor Big Oil Stock #4: Eni (E)
- Expected Returns: 11.9%
Eni is a major oil and gas producer based in Italy. It has exploration activity in more than 40 countries and trades with a market capitalization of $58 billion. It operates in three segments: exploration & production, gas & power, and refining & marketing.
Its upstream segment is by far its largest. In 2018, this segment generated 92% of total operating income. This is a major difference between Eni and the other energy super majors; Eni’s business is much less diversified.
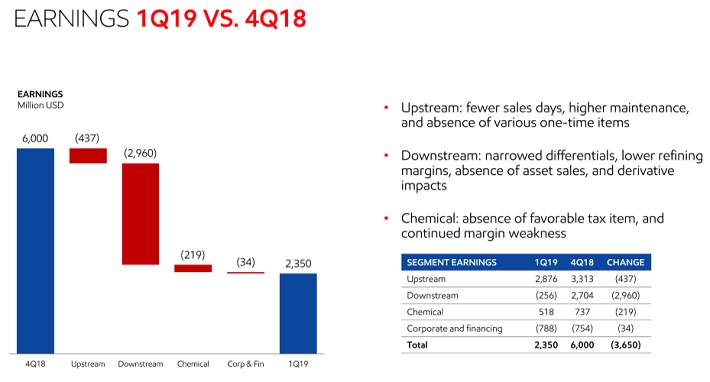
In late April, Eni reported (4/24/19) financial results for the first quarter of fiscal 2019. The average price of Brent fell 5% over last year’s quarter while Eni’s output decreased 1.9%, primarily due to the termination of a production contract in Libya in Q3 of 2018.
Source: Earnings Slides
Due to these factors and the poor refining margins in the quarter, adjusted net profit increased only 1%. Due to ramp-ups in upstream projects that came online in 2018, Eni continues to expect 2.5% production growth this year, with output expected to accelerate in the second half of the year. Due to the lackluster performance in the first quarter, we have slightly lowered our earnings-per-share estimate for this year, from US$2.95 to US$2.90.
Eni expects to grow its output by approximately 3.0% per year on average until 2025. As such, we believe it is reasonable to expect Eni to grow its earnings-per-share by at least 5.0% per year over the next five years. In such a case, the company will grow its earnings-per-share from an expected level of US$2.90 this year to US$3.70 in 2024.
Eni stock is trading for a 2019 P/E ratio of 11.0, which is lower than its 10-year historical average of 12.5. If the stock reverts to its average valuation level over the next five years, it will enjoy a 2.6% annualized gain. Eni appears undervalued at current price.
Eni also has a 4.3% after-tax dividend yield, leading to total expected returns of 11.9% per year over the next five years.
Supermajor Big Oil Stock #5: Exxon Mobil (XOM)
- Expected Returns: 11.7%
Exxon Mobil is the largest publicly-traded oil stock on this list, with a market capitalization of $317 billion. It is also among the most highly-regarded dividend growth stocks in the energy sector, as it is a member of the Dividend Aristocrats, an exclusive group of 57 stocks with 25+ consecutive years of dividend growth.
You can download an Excel spreadsheet of all 57 (with metrics that matter) by clicking the link below:
We believe Exxon Mobil has a secure dividend, even throughout an industry downturn. You can see a video further detailing our analysis of Exxon Mobil’s dividend below:
In the downturn of the oil market, which began in 2014, Exxon Mobil saw its EPS plunge 75%, from $7.60 in 2014 to $1.88 in 2016. Still, this performance was much better than that of Chevron and BP, which posted losses in 2016, while Royal Dutch Shell’s EPS plunged 87%. As a result, Exxon Mobil proved that it is more resilient than most of its peers during downturns thanks to its more integrated structure.
On the other hand, Exxon Mobil’s conservative structure means it has greatly underperformed its peers in terms of production growth. Its current production level around 4.0 million barrels/day is the same level that the company was producing a decade ago. During this decade, management has repeatedly pledged output growth but it has not delivered so far. This is the main reason behind the pronounced underperformance of the oil giant relative to its peers, during the ongoing recovery of the oil industry.
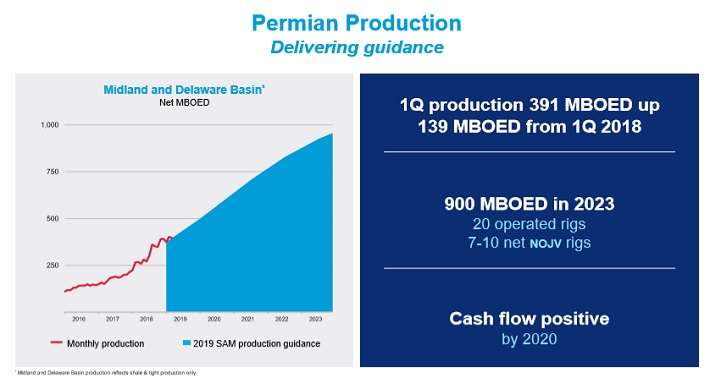
In late April, Exxon reported (4/26/19) financial results for the first quarter of fiscal 2019. The company posted production of 4.0 million barrels per day, up 2% over last year’s quarter. However, its EPS plunged 49%, from $1.09 to $0.55, and missed the analysts’ consensus of $0.68.
Half of the earnings decrease resulted from poor margins in refining and chemicals, as well as heavy scheduled maintenance. Refining margins were affected by the collapse of the discount of Canadian crude to WTI due to Alberta’s enforced production cuts and additional takeaway capacity in the Permian Basin.
Source: Earnings Slides
However, Exxon management recently announced a drastic increase in capital expenditures in order to finally restore production growth. It intends to boost capital expenditures from $24 billion this year to $28 billion in 2020, and about $30 billion per year during 2023-2025. In this way, it aims to raise the output by approximately 25% within the next 7 years, from 4.0 million to 5.0 million barrels/day. It also expects to grow EPS by 135% over this time frame if the price of oil averages $60 in 2025.
We expect Exxon Mobil to generate EPS of $4.20 in 2019. Based on this, the stock has a P/E ratio of 17.8. During the past decade, Exxon Mobil has traded with an average P/E ratio in the 17 to 18 range, but this includes “artificial” years when profits dropped dramatically while the share price held up much better. During 2009-2015, the average multiple was closer to 13 times earnings. This is a number we are more comfortable with given our expectation of “normalized” earnings over the intermediate-term.
A declining valuation multiple could reduce annual returns by 6.1% per year through 2024. That said, we expect annual EPS growth of ~13.2% per year over the next five years, comprised of production growth, margin improvements and share repurchases. The stock also has a 4.6% dividend yield, leading to total expected returns of 11.7% per year.
Supermajor Big Oil Stock #6: Chevron (CVX)
- Expected Returns: 10%
Chevron is the second-largest U.S.-based oil company, behind Exxon Mobil. And, like Exxon, Chevron is a Dividend Aristocrat. We also view Chevron’s dividend as sustainable, as further detailed in the video below:
In 2018, Chevron generated 78% of its earnings from its upstream segment. Close industry peers Exxon Mobil, BP, and Total produce crude oil and natural gas at approximately equal ratios. But Chevron is more leveraged to the oil price with a 61/39 production ratio. Moreover, as the company prices a significant portion of its natural gas volumes based on the oil price, about 75% of its total output is based on the oil price.
In late April, Chevron reported (4/26/19) financial results for the first quarter of fiscal 2019. Its production grew 7% over last year’s quarter, primarily thanks to strong performance in the Permian Basin and at Wheatstone in Australia. Its total output exceeded 3.0 million barrels per day for the second quarter in a row.
Source: Investor Presentation
However, earnings fell 27%, from $3.6 billion to $2.6 billion. Half of the decrease resulted from low margins in the refining and chemical business while lower oil prices also played a role.
Chevron invested heavily in growth projects for years but failed to grow its output for an entire decade, as oil projects take several years to start bearing fruit. Fortunately, Chevron is now in the positive phase of its investing cycle, as it is growing its output thanks to past investments while reducing its capital expenses. Chevron grew its output by 7% in 2018, and expects to grow its output by 4%-7% this year and by 3%-4% per year until 2024.
We estimate EPS of approximately $7.40 for 2019, which means Chevron stock trades for a P/E ratio of 16.9. This is above the 10-year average valuation multiple of 15.8, which is also our fair value estimate for the stock. As a result, Chevron appears to be slightly overvalued. If the valuation multiple declines to the historical average, it would reduce annual returns by 1.3%.
On the other hand, we expect 7%-8% annual EPS growth for Chevron. And, the stock has a 3.8% dividend yield, which results in total expected returns of 10% per year over the next five years.
Final Thoughts
Eni is the most leveraged oil major to the price of oil, so it stands to benefit the most if oil prices rise considerably in the coming months. Meanwhile, Exxon Mobil is arguably the most conservatively run company, with the strongest balance sheet of the group. It has the highest credit rating of the oil majors, and has increased its dividend each year for over 30 years (as has Chevron).
On the other hand, Royal Dutch Shell seems to have the potential to offer the highest 5-year return. It possesses the strongest combination of an undervalued share price, future EPS growth potential, and a high dividend yield.
All of the Big Oil stocks on this list are expected to generate attractive returns to shareholders of at least 10% per year through 2024. This makes all six potentially attractive picks for investors, particularly those looking for income as the group widely offers high dividend yields.